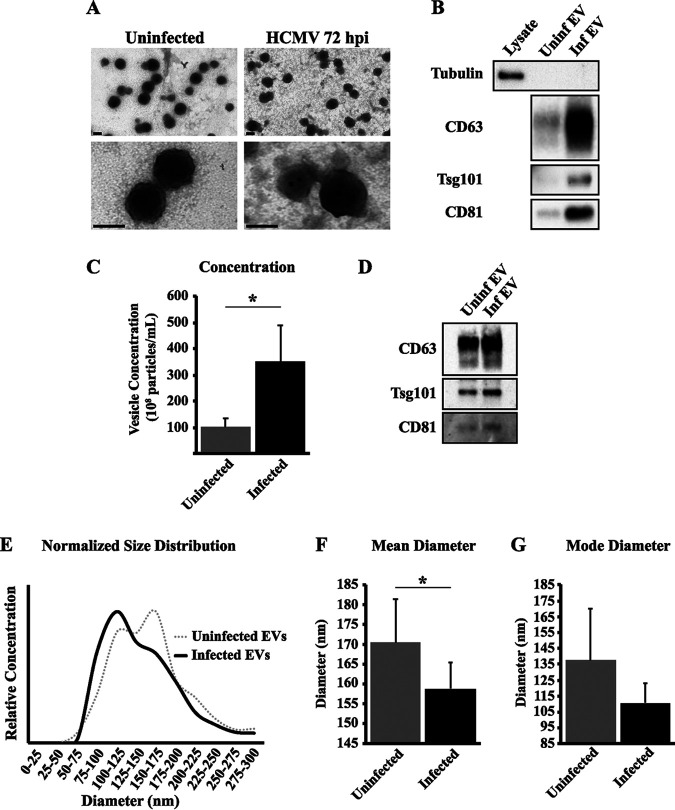
FIG 4.
HCMV infection increases EV production. Analysis of EV populations was carried out using EV fractions from uninfected or HCMV-infected (MOI = 1) fibroblasts at 72 hpi. (A) Electron micrographs of pooled EV fractions. Scale bars are 50 nm. (B) Western blot analysis of pooled EV fractions for tubulin, CD63, Tsg101, and CD81 loaded at equal volumes. Lysate is from HCMV-infected (MOI = 1) fibroblasts at 72 hpi. (C) Particle concentration of pooled EV fractions assayed by nanoparticle tracking analysis (NTA). (D) Western blot analysis of EV fractions loaded at equal vesicle numbers. Normalized size distributions (E), mean diameters (F), and mode diameters (G) of pooled EV fractions. All NTA analyses are from seven independent EV harvests. *, P < 0.05.

