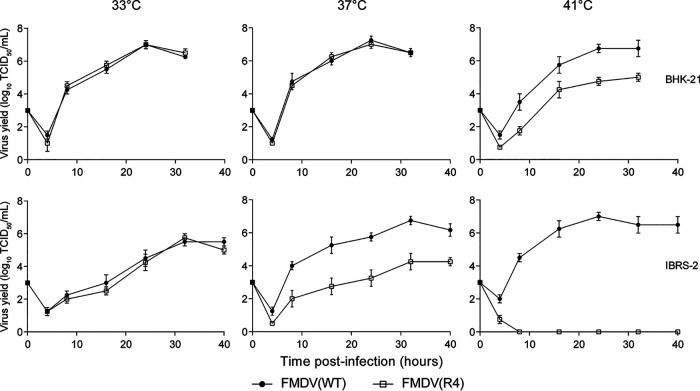
FIG 2.
Growth curves of FMDV(R4) at different temperatures. The graphs indicate the growth kinetics of FMDV(WT) and FMDV(R4) in BHK-21 and IBRS-2 cells. Cells were infected and incubated at 33°C, 37°C, or 41°C. The virus titers were determined by TCID50 assay on monolayers of BHK-21 cells. All data are expressed as the means ± standard deviations (SDs) from three independent experiments.

