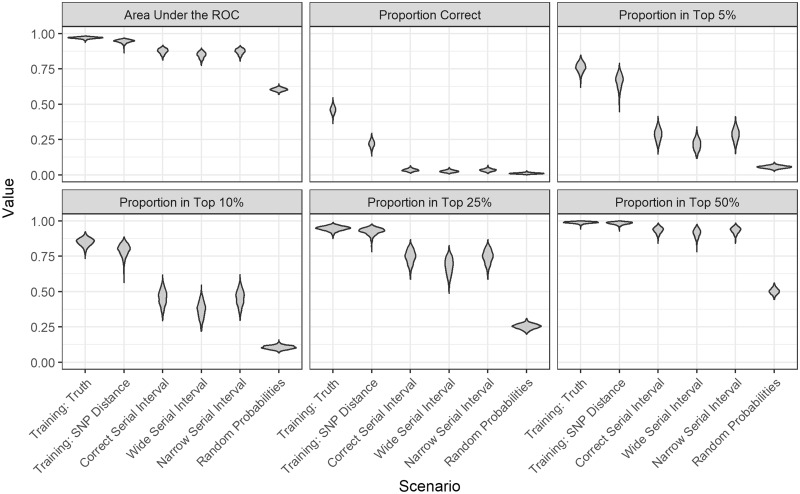
Figure 2.
Violin plots of the performance metrics for the different scenarios across 1000 simulated outbreaks. The scenarios were: our method with a training set of true links; our method with a training set of links defined by single nucleotide polymorphism (SNP) distance; probabilities derived from the serial interval distribution used to simulate the outbreak: gamma(1.05, 2.0); probabilities derived from a serial interval distribution that is too wide: gamma(1.3, 3.3) and too narrow: gamma(0.54, 1.9); and random probabilities. The metrics shown are the area under the receiver operating curve (AUC), the proportion of time the true infector was assigned the highest relative transmission probability (Proportion Correct), and the proportion of time the probability of the true infector was ranked in the top 5%, 10%, 25%, and 50% of all possible infectors.

