Fig. 2.
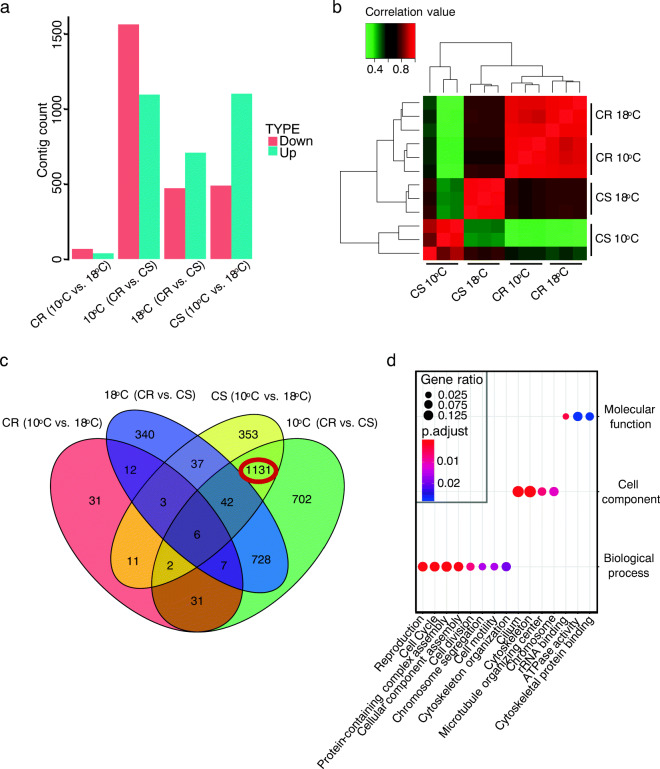
Differentially expressed contigs (DECs) in H. oligactis. a The number of DECs in each comparison group. We computed DECs between the strains to obtain the contigs related to specific processes. The comparisons between different temperatures (10 °C and 18 °C) reflect temperature shift-specific differences, while DECs between different strains (CR and CS) represent strain-specific differences. Also, we expected a higher number of DECs between CS at 10 °C and other asexual strains as these DECs will also represent the change of spermatogenesis and aging. Because of only 103 DECs between the CR strain at different temperatures, there is no need for comparison between CR at 18 °C and CS at 10 °C. b Heat map of correlation between hydra samples. Expression values for all samples were compared, and Pearson correlation values were plotted. Asexual samples (CS and CR both at 18 °C) cluster according to Pearson correlation values, indicating high similarity. CS at 18 °C is an outlier among asexual samples due to strain differences. c Venn diagram of DECs in group comparisons. We overlapped the DECs from (a) to identify key DECs related to the temperature shift in CS. d GO term enrichment results using 1131 DECs. Size of each dot represents Gene Ratio enrichment for each category while color indicates Padj value.

