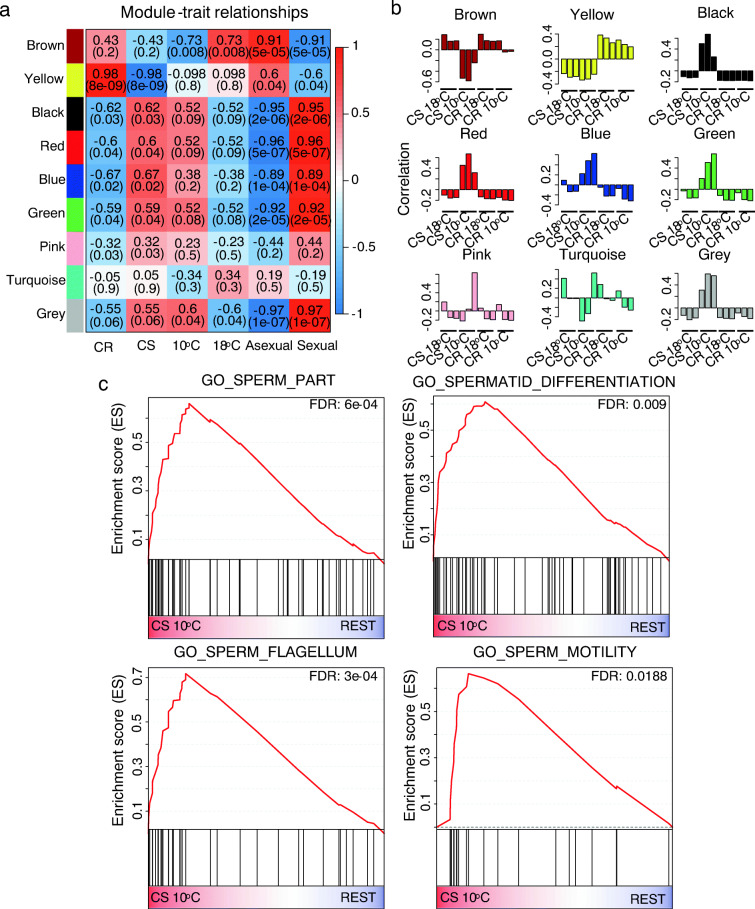
Fig. 3.
Weighted gene co-expression network analysis a The relationships between gene modules and sample traits. The values in the top are the Pearson correlation values, while the values in the bracket are the p-values. b The correlations between gene modules and every sample are plotted. Positive values indicate positive correlation between module and sample. c The upregulation of spermatogenesis-related gene sets in CS at 10 °C to promote sexual reproduction

