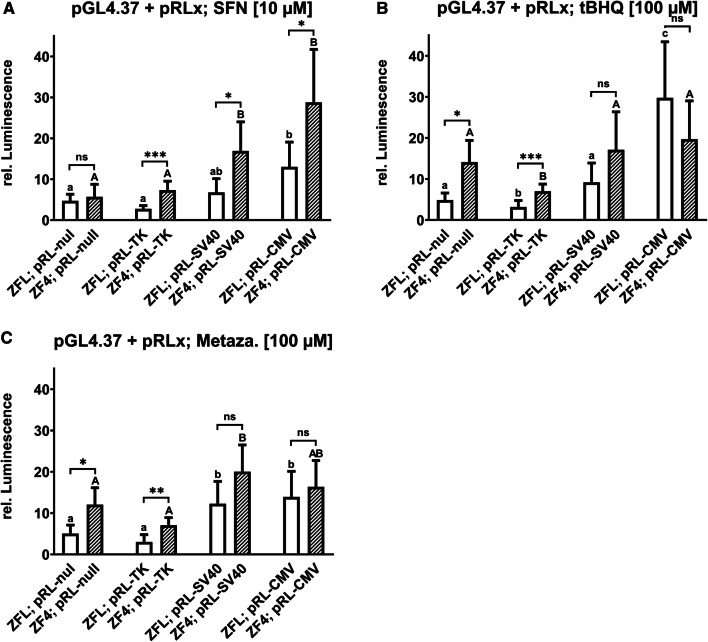
Fig. 1.
Effects on luminescence measured in the zebrafish cell lines ZFL and ZF4 treated with selected nominal concentrations of sulforaphane (a; SFN), tertbutylhydroquinone (b; tBHQ), and metazachlor (c). Luminescence corresponds to quantitative Nrf2 activation measured via DLR assay in cells co-transfected with pGL4.37 and the specifically depicted normalization vectors. Normalized values are depicted as white bars for ZFL and striped bars for ZF4. Each bar represents the mean (experimental units n = 3; observational units N = 12) including SD. Asterisks indicate significance between different cell lines for identical transfection setups, tested in a two-way ANOVA mixed model with Tukey’s post hoc test (ns P > 0.05; *P < 0.05, **P < 0.01, ***P < 0.001). Lowercase letters indicate statistically significant differences between transfection setups in the ZFL cell line (P < 0.05). Uppercase letters indicate a statistically significant difference between transfection setups in the ZF4 cell line (P < 0.05). Numerical means are illustrated in Tab. S2

