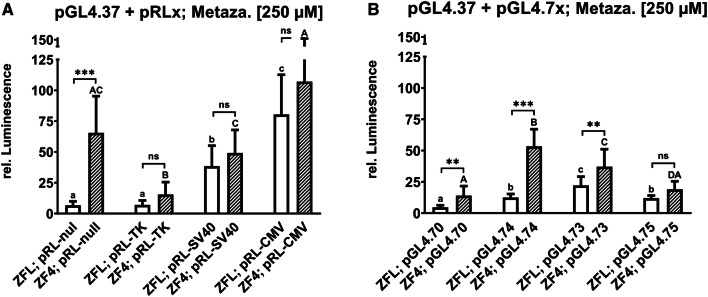
Fig. 2.
Effects on luminescence measured in the zebrafish cell lines ZFL and ZF4 treated with 250 µM metazachlor. Luminescence corresponds to quantitative Nrf2 activation measured via DLR assay in cells co-transfected with pGL4.37 and the specifically depicted normalization vectors of the pRLx (a) and pGL4.7x (b) series. Normalized values are depicted as white bars for ZFL and striped bars for ZF4. Each bar represents the mean (experimental units n = 3; observational units N = 12) including SD. Asterisks indicate significance between different cell lines for identical transfection setups, tested in a two-way ANOVA mixed model with Tukey’s post hoc test (ns P > 0.05; *P < 0.05, **P < 0.01, ***P < 0.001). Lowercase letters indicate statistically significant differences between transfection setups in the ZFL cell line (P < 0.05). Uppercase letters indicate a statistically significant difference between transfection setups in the ZF4 cell line (P < 0.05). Numerical means are illustrated in Tab. S3

