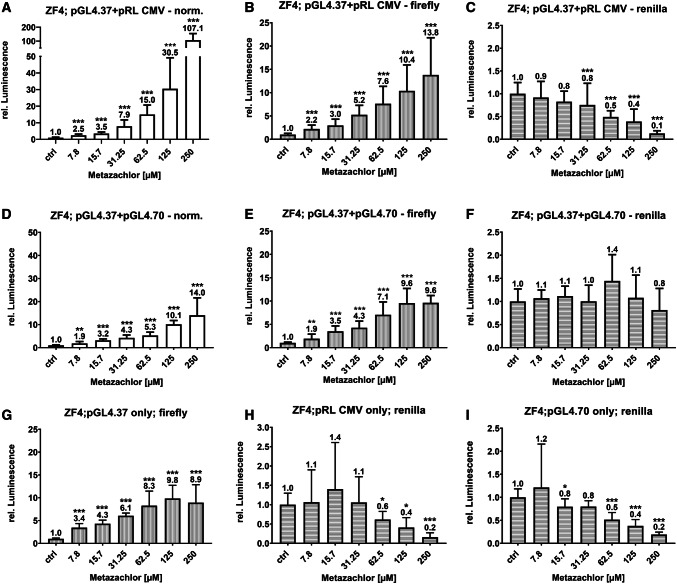
Fig. 3.
Effects on luminescence measured in the zebrafish cell line ZF4 treated with metazachlor. Luminescence corresponds to quantitative Nrf2 activation measured via DLR assay in cells co-transfected with pGL4.37 (a–f) and the normalization vectors pRL-CMV (a–c) and pGL4.70 (d–f). To uncover co-transfection artifacts, the specific plasmids were also solely transfected (g–i). Normalized values are depicted as white bars, Firefly luciferase read-outs as gray bars with vertical stripes, and Renilla luciferase read-outs as gray bars with horizontal stripes. Each bar represents the mean (experimental units n = 3–4; observational units N = 10–16) including SD. Numerical means are depicted on top of bars. Asterisks indicate significance tested in a two-way ANOVA mixed model with Dunnett's post hoc test (*P < 0.05, **P < 0.01, ***P < 0.001)

