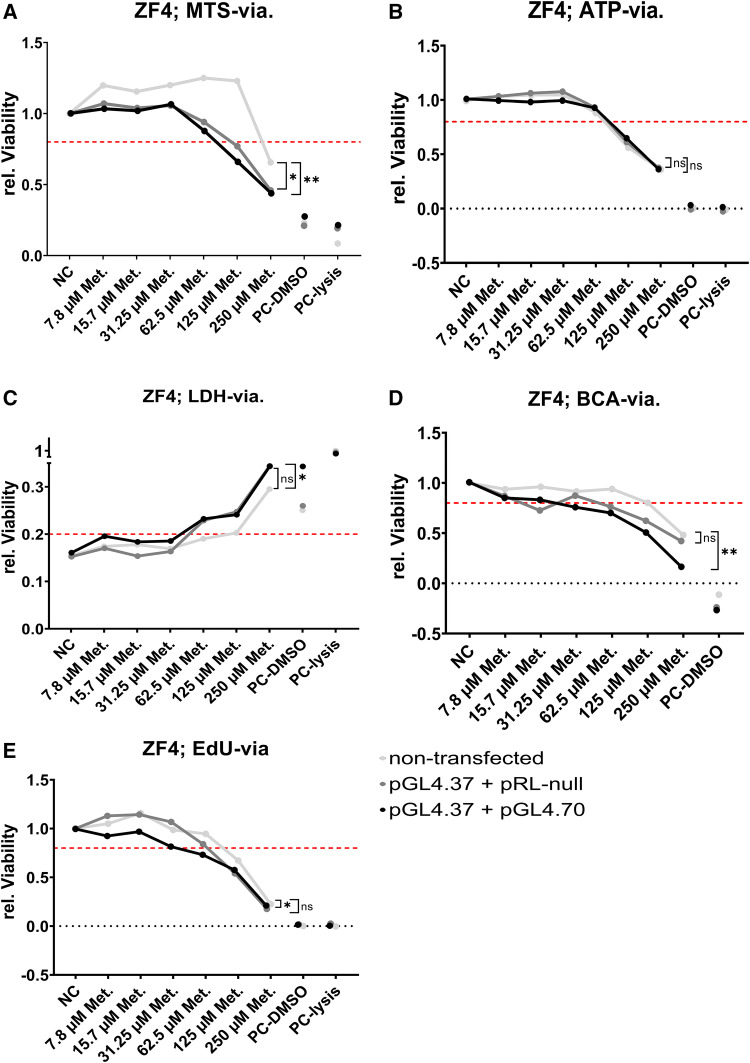
Fig. 4.
Effects on various viability end points (dots connected by lines) measured in the zebrafish cell line ZF4 treated with metazachlor (Met.). End points quantified are NAPDH metabolism via the MTS assay (a), ATP turnover (b) and LDH release (c) via the ATP/LDH multiplex assay, total protein amount via the BCA assay (d), and cell proliferation via the EdU assay (e). A solvent control was used as negative control (NC). Cellular lysis buffer (PC-lysis) and 10% (v/v) of DMSO in nutrition medium (PC-DMSO) were used as positive controls. Initial values were normalized to the NC or PC (c), respectively. A threshold value of 0.8 or 0.2 (for LDH) was considered biologically relevant/significant (dotted red line). Each point represents the mean (experimental units n = 3–4; observational units N = 9–12). Asterisks indicate significance of main transfection effect tested via two-way ANOVA, followed by Holm–Sidak’s post hoc test (ns P > 0.05; *P < 0.05, **P < 0.01, ***P < 0.001). For every end point, firstly, non-transfected cells were exposed (light gray dots), and, secondly, cells were co-transfected with pGL4.37 and normalization vectors of increasing size, pRL null (3320 nt; dark gray dots) and pGL4.70 (3522 nt; black dots). For details and further statistics, see also Fig. S15 and Tab. S6

