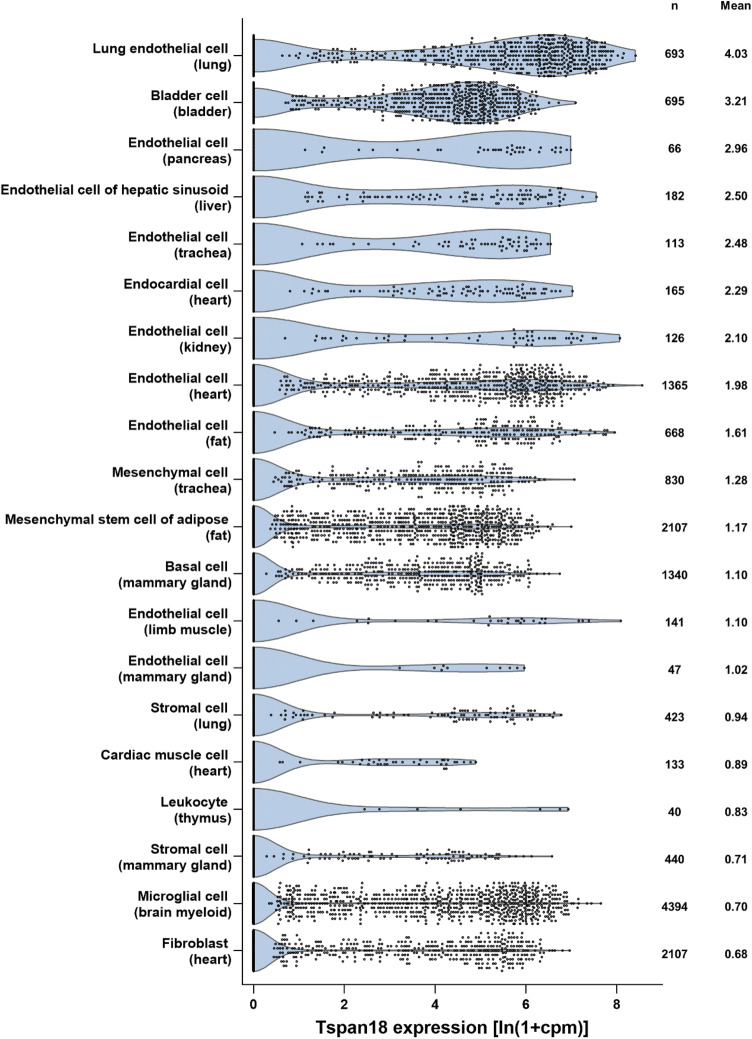
Fig. 2.
Tspan18 is preferentially expressed by endothelial cells. Mouse Tspan18 expression was analysed from publicly available single-cell RNA-Seq data sets from the Tabula Muris Consortium [34], which contains data from 53,760 cells from 20 organs or tissues of seven mice. Tabula Muris data for gene counts from cells sorted by flow cytometry were normalized to counts per million (cpm) and presented as ln(1 + cpm). Data from the top 20 cell types (tissue of origin in brackets), ranked by mean expression, were visualized as violin plots; n represents number of cells

