Fig. 6.
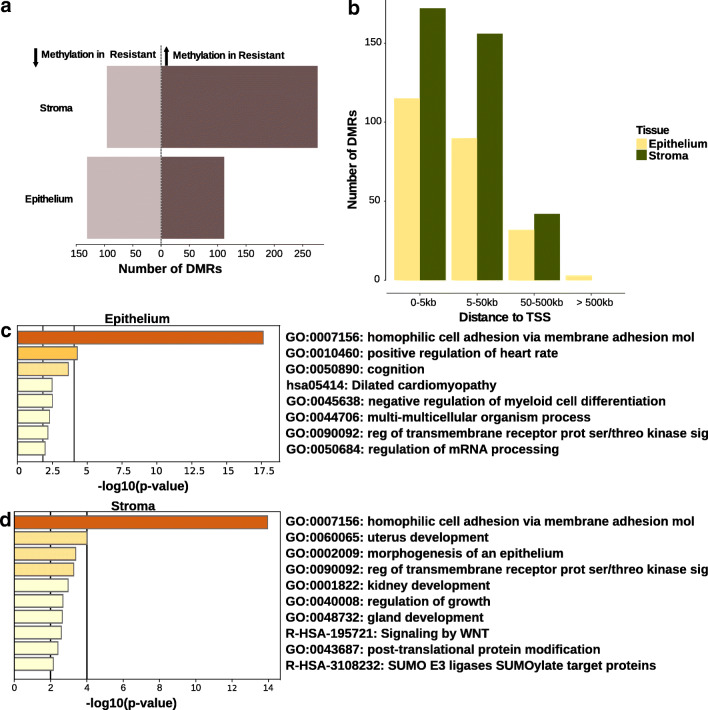
Differentially methylated regions in the stroma and epithelium of resistant vs sensitive patients. a The number of differentially methylated regions (DMRs) with at least 30% difference in DNA methylation in resistant vs sensitive patients. The number of regions with decreased methylation in resistant samples is depicted to the left side of the dotted line (light brown), the regions with increased methylation to the right (dark brown). b Number of DMRs per tissue and their proximity to gene transcription start sites (TSS). c–d Gene ontology and pathway enrichment analysis for genes associated with DMRs (proximal to TSS, 5 kb upstream and downstream of the TSS) in epithelium (c) and stroma (d). The negative log of the enrichment p values are depicted on the x-axes; vertical lines mark arbitrary cut-off p values at p = 0.01 and p = 0.0001. Associated GO terms are depicted on the y-axes

