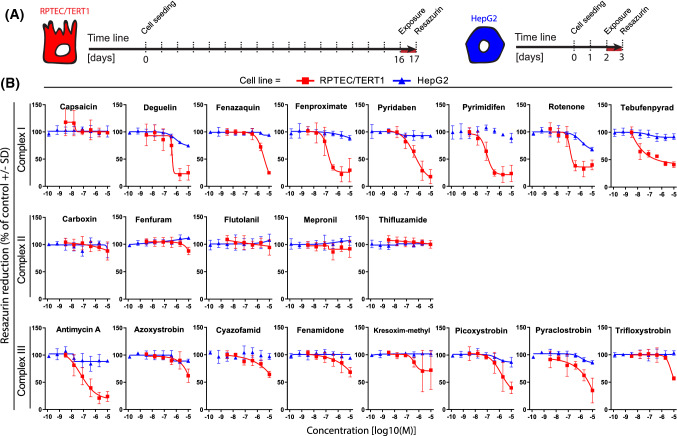
Fig. 2.
Effect of compound exposure on cellular viability as measured by resazurin reduction. a Schematic representation of the experimental setup in RPTEC/TERT1 and HepG2 cells, the red line represents the exposure time. b Concentration response curves of resazurin reduction in RPTEC/TERT1 and HepG2 cells exposed for 24 h to a range of concentrations (1.28E−10, 6.40E−10, 3.20E−9, 1.60E−8, 8.00E−8, 4.00E−7, 2.00E−6, 1.00E−5M) of complex I, complex II and complex III inhibitors of the ETC. RPTEC/TERT1 (red) and HepG2 (blue). Values are represented as percentage of vehicle controls (0.1% DMSO) and further normalized to the average of at least two non-effective concentrations (if applicable) set as 100%. Measurements are average of at least three independent experiments ± SD. Connecting lines are non-linear fits (Y = bottom + (top − bottom)/(1 + 10^((LogIC50-X) × HillSlope))) (color figure online)

