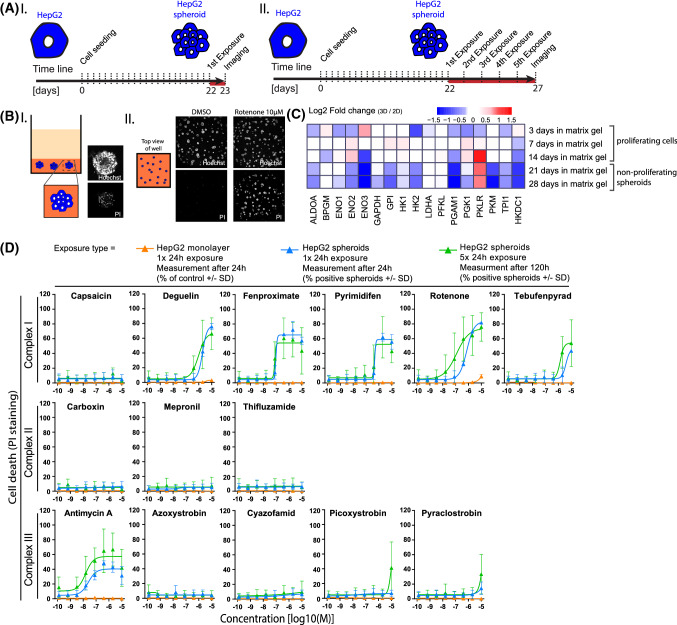
Fig. 8.
Comparison of compound induced toxicity in 2D cultured HepG2 and 3D HepG2 spheroids. a Schematic representation of cell culture/differentiation protocol and time of endpoint measurements in HepG2 spheroids treated with two exposure regimes; I = 1 × 24 h exposure, measured after 24 h and II = 5 × 24 h exposure, measured after 120 h. b (I) Schematic representation of HepG2 spheroids in a 384 well, with a representative picture of a single spheroid stained with nuclear marker (Hoechst) and cell death marker (PI). (II) Representative images of a 384 well with spheroids cultured in glucose-containing medium followed by exposure to 10 µM rotenone or DMSO (24 h) and stained with nuclear marker and cell death marker. c Heatmap of changes in glycolytic enzyme genes during HepG2 spheroids maturation, in medium containing glucose, showing the evolution toward a less glycolytic state. Log2 fold changes represent the expression of untreated HepG2 cells cultured in matrix gel (3D) at day 3, 7, 14 (proliferating cells) and 21, 28 (non-proliferating spheroids) over untreated HepG2 cells cultured on plastic (2D) for 3 days. d Difference in the cytotoxicity responses upon treatment with a range of concentrations (1.28E−10, 6.40E−10, 3.20E−9, 1.60E−8, 8.00E−8, 4.00E−7, 2.00E−6, 1.00E−5M) of CI, CII and CIII inhibitors in HepG2 monolayer (2D) and HepG2 spheroids (3D) with a 1 x 24 h exposure or a consecutive 5 × 24 h exposure. All conditions are in glucose containing medium. Cell death endpoint was assessed with PI staining at the end of treatments. Values are expressed as percentage of PI positive cells/spheroids ± SD and are mean of two or three independent experiments (color figure online)

