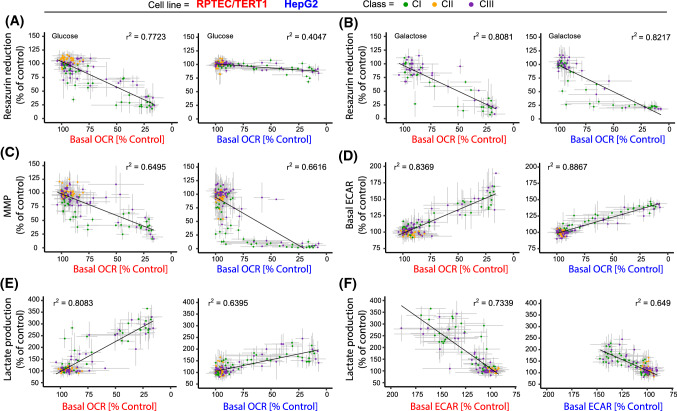
Fig. 9.
Assay correlation plots. Graphs A to E show the correlation of the highly sensitive 30 min OCR Seahorse measurement with the other assays for all conditions. Each graph relates the OCR response, per compound and per concentration, to the one obtained with the correlating assay with the same treatment condition. Data include the mean of all replicates ± SD, slope’s r2 values are provided. Classes are distinguished by colour, CI inhibitors (green), CII inhibitors (orange) and CIII inhibitors (purple). a Basal 30 min OCR vs 24 h resazurin in glucose settings. b Basal 30 min OCR vs 24 h resazurin in galactose settings. c Basal 30 min OCR vs 24 h MMP. d Basal 30 min OCR vs basal 30 min ECAR. e Basal 30 min OCR vs 24 h supernatant lactate. f This graph has the same metrics as the other graphs but shows the correlation of 30 min Seahorse ECAR measurement with 24 h supernatant lactate measurement. Note the X-axis is reversed for clarity (color figure online)

