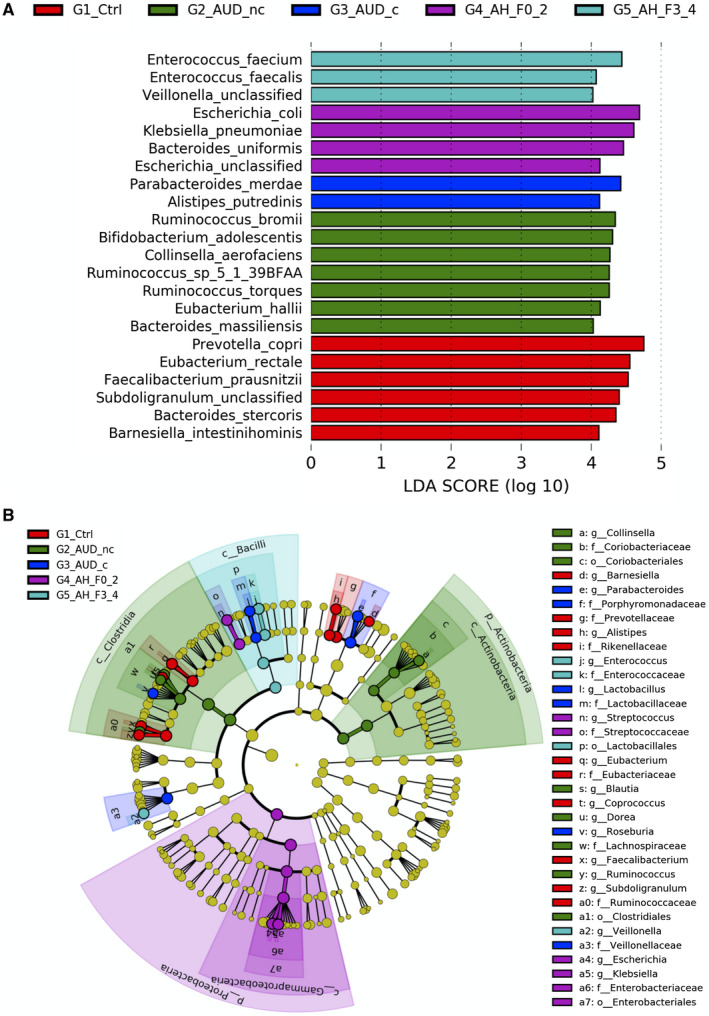
Fig. 1.

LEfSe analysis of the gut microbial taxonomy. (A) Enriched species (LDA score > 4) in controls, patients with alcohol use disorder without cirrhosis, patients with alcohol use disorder with cirrhosis, patients with alcoholic hepatitis without cirrhosis, and patients with alcoholic hepatitis with cirrhosis. (B) Taxonomic representation of statistically and biologically consistent differences in the five groups. Differences are represented in the color of the most abundant class. Each circle's diameter is in proportion to that taxon's abundance. Abbreviations: G1_Ctrl, controls; G2_AUD_nc, patients with alcohol use disorder without cirrhosis; G3_AUD_c, patients with alcohol use disorder with cirrhosis; G4_AH_F0_2, patients with alcoholic hepatitis without cirrhosis; G5_AH_F3_4, patients with alcoholic hepatitis with cirrhosis.
