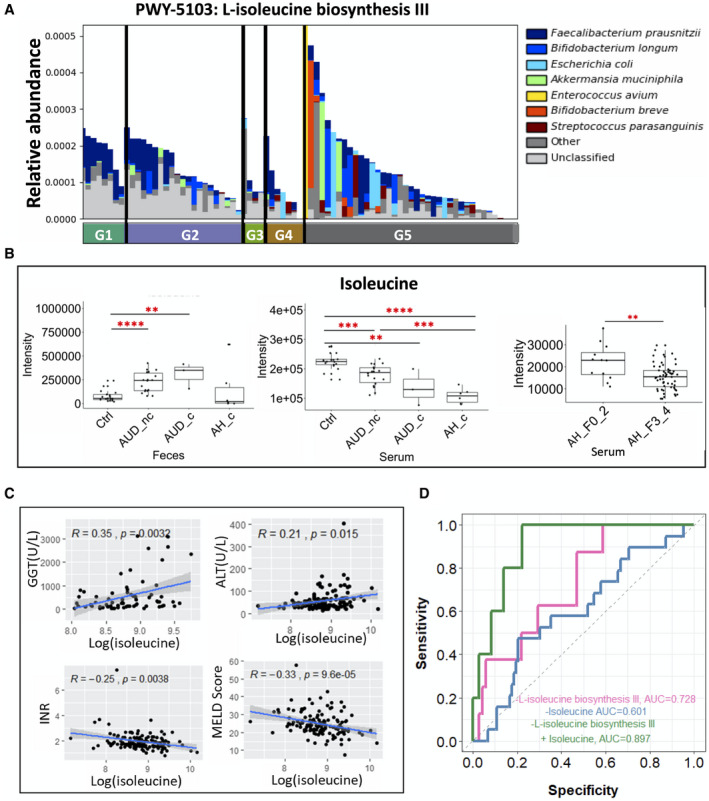
Fig. 5.

Isoleucine metabolism. (A) Relative abundance of microbial L‐isoleucine biosynthesis III in five groups. (B) Fecal and serum level of isoleucine. (C) Spearman correlation between isoleucine level (log transformation) in the serum of patients with alcoholic hepatitis and gamma‐glutamyl‐transferase, alanine aminotransferase, INR, and MELD score. (D) AUROC using different predictors related the isoleucine metabolism. Alive group, n = 38; deceased group, n = 5. *P < 0.05, **P < 0.01, ***P < 0.001, ****P < 0.0001. Abbreviations: ALT, alanine aminotransferase; GGT, gamma‐glutamyl‐transferase.
