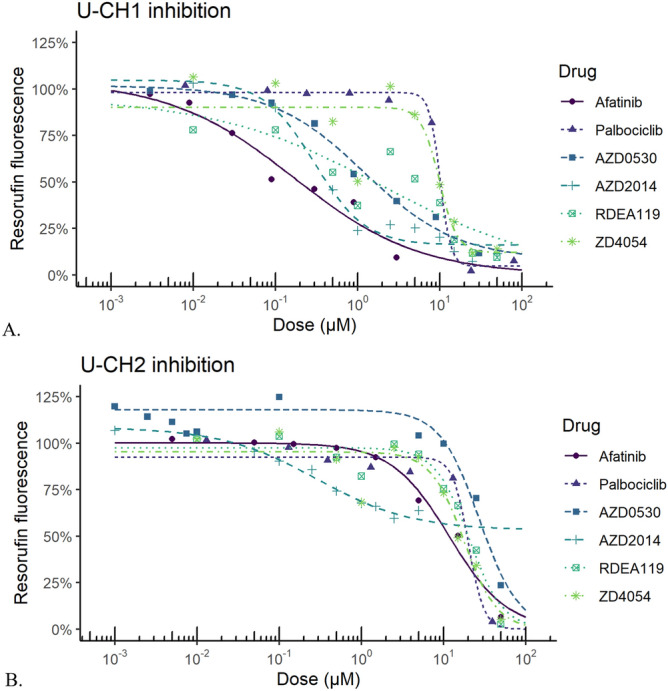
Figure 3.

Representative dose response curves for compounds tested against chordoma cell lines in vitro. Molecules were tested in (A) U-CH1 cells and (B) U-CH2 cells. Graphs produced with R66 version 3.6.2 (https://cran.r-project.org/), with the following packages: drc 3.0–6 for general dose–response curve fitting and analysis, medrc 1.1–0 for mixed-effects modeling of dose–response data, multcomp 1.4–11 for multiple comparison testing, and ggplot2 3.2.1 for plotting.
