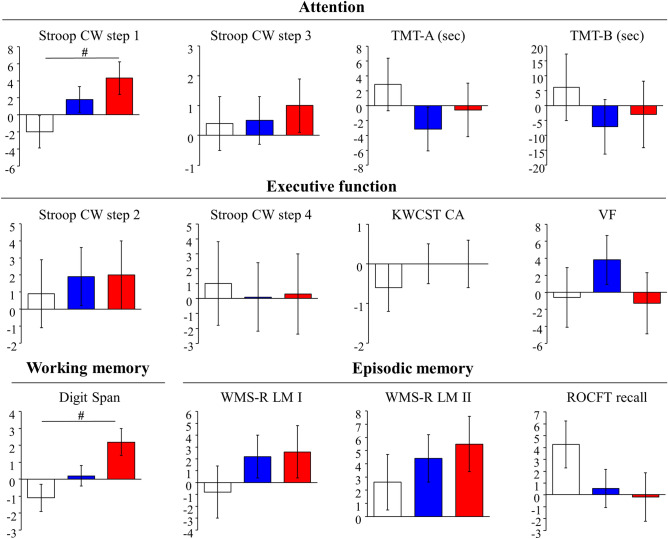
Figure 2.
Changes in neuropsychological tests adjusted by baseline scores in the groups during the intervention in the subgroup with low SMI. Mean ± SE. White column, no Ex with placebo (n = 8); blue column, Ex with placebo (n = 12); red column, the Ex with LCPUFA (n = 8). #p < 0.05 vs. the no Ex with placebo group (Dunnett's). Stroop CW, Stroop Colour-Word; TMT, Trail making test; KWCST CA, Wisconsin card sorting test of Keio version category achieved; VF, Verbal fluency; WMS-R LM I/II, Wechsler memory scale revised logical memory I/II; ROCFT, Rey–Osterrieth complex figure test; SMI, skeletal muscle mass index.

