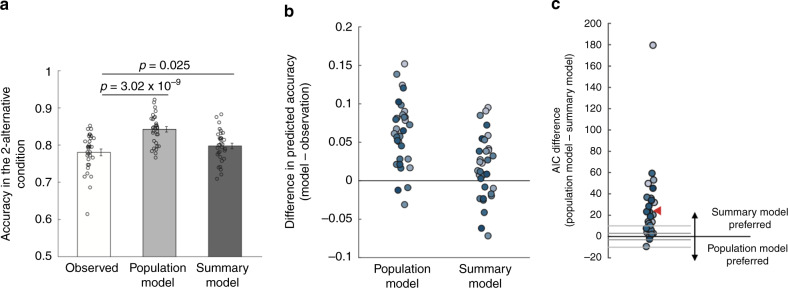
Fig. 4. Comparisons between the population and summary models in Experiment 1.
a Mean accuracy in the two-alternative condition observed in the actual data (white bar), and predicted by the population (light gray bar) and summary (dark gray bar) models. The predictions for both models were derived based on the data in the four-alternative condition. All p values are derived from two-sided paired t tests. Error bars represent SEM, n = 32. b Individual subjects’ differences in the accuracy in the two-alternative condition between the two models and the observed data. c Difference in Akaike Information Criterion (AIC) between the population and the summary models. Positive AIC values indicate that the summary model provides a better fit to the data. Each dot represents one subject. The gray horizontal lines at ±3 and ±10 indicate common thresholds for suggestive and strong evidence for one model over another. The red triangle indicates the average AIC difference. The summary model provided a better fit than the population model for 30 of the 32 subjects.

