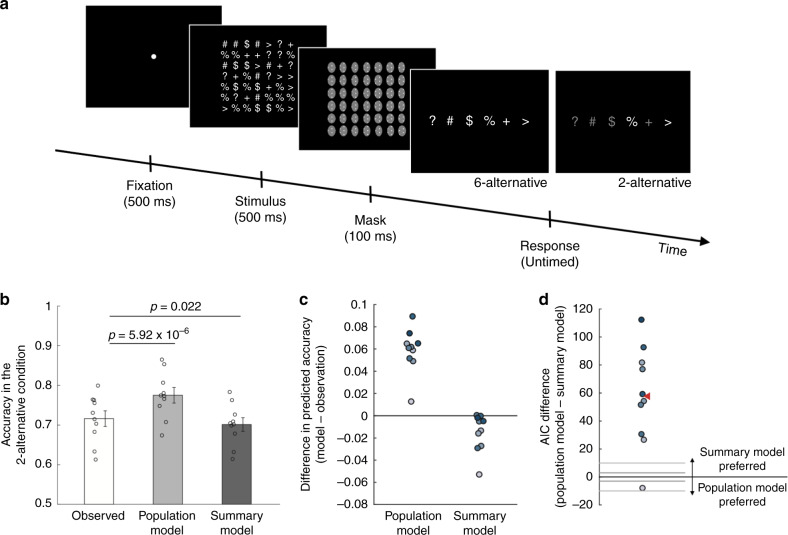
Fig. 5. Task and results for Experiment 2.
a The task in Experiment 2 was similar to Experiment 1 except for using six different symbols (question mark, pound sign, dollar sign, percentage sign, plus sign, and greater-than sign) instead of four different colors. One of the symbols was presented more frequently (14 times, dominant symbol) than the others (7 times each, nondominant symbols) and the task was to indicate the dominant symbol. Two conditions were presented in different blocks: a six-alternative condition where subjects chose between all six symbols and a two-alternative condition where subjects were given a choice between the dominant and one randomly chosen nondominant symbol. b Mean accuracy in the two-alternative condition observed in the actual data (white bar) and predicted by the population (light gray bar) and summary (dark gray bar) models. The predictions for both models were derived based on the data in the six-alternative condition. All p values are derived from two-sided paired t tests. Error bars represent SEM, n = 10. c Individual subjects’ differences in the accuracy of the two-alternative condition between the two models and the observed data. d AIC difference between the population and the summary models. Positive AIC values indicate that the summary model provides a better fit to the data. Each dot represents one subject. The red triangle indicates the average AIC difference. The summary model provided a better fit than the population model for nine out of ten subjects.

