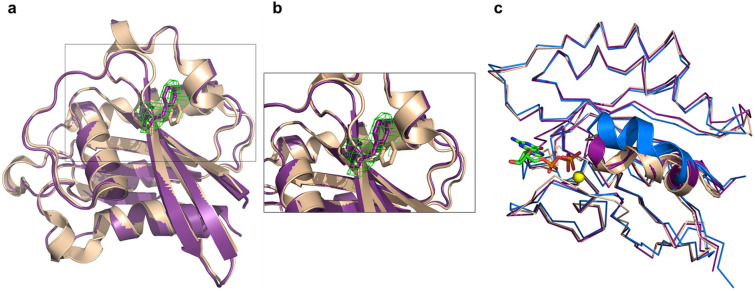
Figure 3.
Conformational changes of Rab33B upon Atg16L1 binding. (a) Cartoon representation of Atg16L1 bound mRab33B purple superimposed with GppNHp-bound Rab33 (PDB accession code 1Z0634 shown in wheat. Residue F70 is shown in stick representation in purple for Rab33B and colored wheat for GppNHp-bound Rab33. (b) Close up view of Rab33B residue F70. The omit Fo–Fc difference electron density map (green) is contoured at + 2σ. (c) Ribbon representation of mRab33B in purple with bound GTP shown as green stick model and Mg2+ as a yellow sphere superimposed with GppNHp-bound Rab33 (PDB accession code 1Z0634 in wheat and GDP-bound Rab33 (PDB accession code 2G7734 in blue. The Switch II region is shown in cartoon representation.

