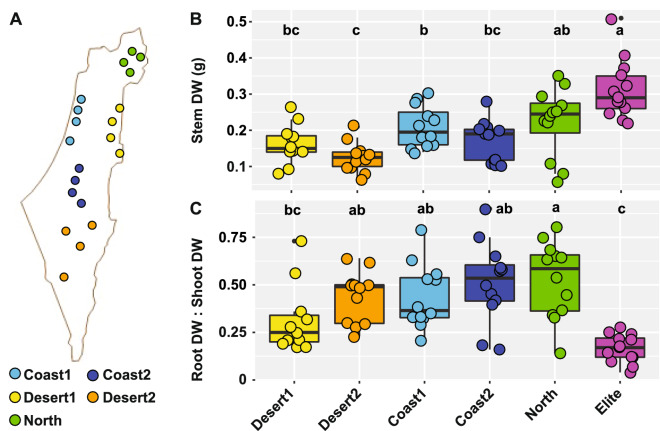
Figure 1.
Plant growth parameters of the wild and domesticated barley genotypes. (A) Distribution of the twenty wild barley genotypes used in this study in the Israeli geographic region. Individual dots depict the approximate sampling location for a given genotype, colour-coded according to the designated eco-geographic area. (B) Stem dry weight of the barley genotypes at the time of sampling. (C) Ratio between root and shoot dry weight of the indicated samples. In (B) and (C), upper and lower edges of the box plots represent the upper and lower quartiles, respectively. The bold line within the box denotes the median, individual shapes depict measurements of individual biological replicates/genotypes for a given group. Different letters within the individual plots denote statistically significant differences between means by Kruskal–Wallis non-parametric analysis of variance followed by Dunn’s post-hoc test (P < 0.05).

