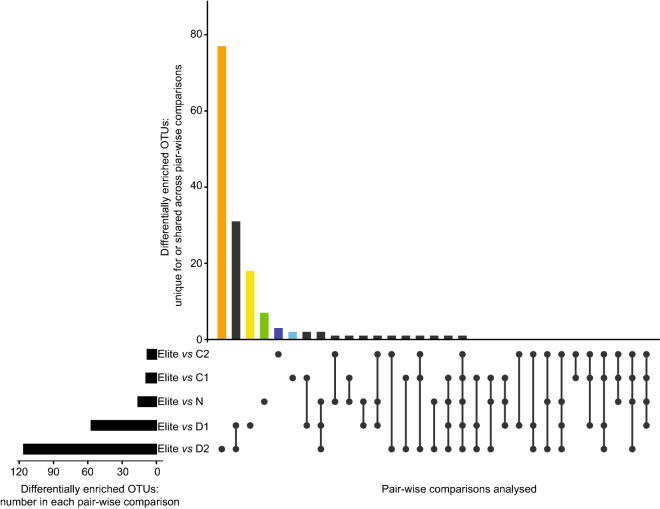
Figure 4.
Enrichments of individual bacteria discriminates between elite varieties and wild barley genotypes. Horizontal black bars denote the number of OTUs differentially enriched (Wald test, P value < 0.05, FDR corrected) in the indicated pair-wise comparisons between elite varieties and groups of wild barley genotypes. Vertical bars depict the number of differentially enriched OTUs unique for or shared among two or more comparisons highlighted by the interconnected dots underneath the vertical bars. Coloured vertical bars depict differentially enriched OTUs unique for the pair-wise comparisons between ‘Elite’ and ‘Coast 2’ (C2, dark blue), ‘Coast 1’ (C1, light blue), ‘North’ (N, green), ‘Desert 1’ (D1, yellow) and ‘Desert 2’ (D2, orange), respectively.

