
Fig. 8. Intracranial fibrocalcific plaques in a segment of an intradural vertebral artery.
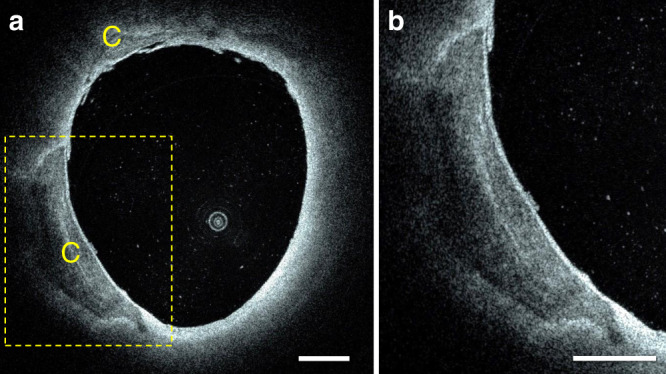
a Two fibrocalcific plaques are visible in the image. A smaller plaque with a calcium thickness between 100 and 300 µm is located at 11 o’clock. A larger plaque with a calcium maximum thickness of 900 µm is located in the bottom-left quadrant of the image. b Magnification showing fine details of the plaque microstructure, including inner and outer boundaries. On HF-OCT, calcific tissue is characterized by a sharply demarcated area with a weaker and heterogeneous signal, resulting from a low optical backscattering and low absorption coefficients. Characterization of HF-OCT versus histopathology for imaging of fibrocalcific plaques was obtained from one intracranial artery specimen. Scale bars are equal to 1 mm.