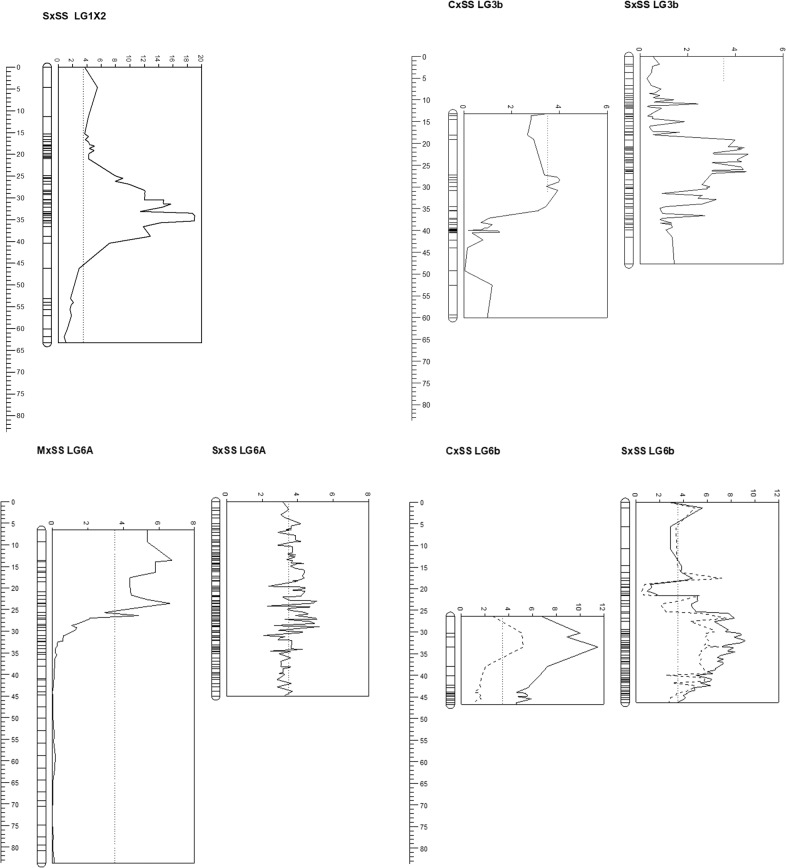
Fig. 3. QTL plots for ellagic acid deoxyhexoside, cinnamoyl glucoside and pelargonidin-3-O-malonylglucoside identified in cultivated strawberry.
Plots of significant QTL (LOD threshold >3.5) on a LG1X of the S×SS mapping population (‘Camarosa’ Fvb1-3) for ellagic acid deoxyhexoside; b LG3b of the C×SS and S×SS mapping populations (‘Camarosa’ Fvb3-2) for cinnamoyl glucoside; c LG6A of the M×SS and S×SS mapping populations (‘Camarosa’ Fvb6-1) for cinnamoyl glucoside; d LG6b of the C×SS and S×SS mapping populations (‘Camarosa’ Fvb6-2) for pelargonidin-3-O-malonylglucoside (unbroken line) and pelargonidin-3-O-acetylglucoside (hashed line). LOD scores are plotted along the x-axes (dotted line indicates the 3.5 LOD threshold), while genetic distances (cM) are plotted along the y-axes. Positions of each homologous linkage group relative to each other in the different maps follow the physical positions of the linkage groups on the ‘Camarosa’ genome sequence

