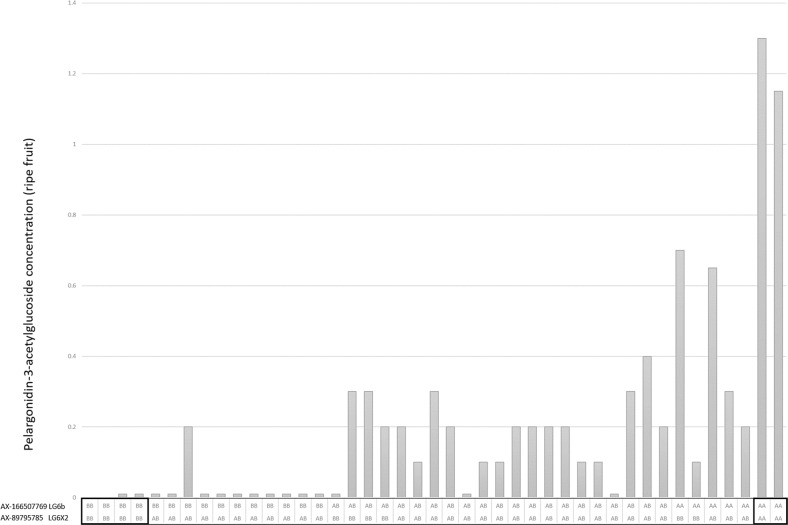
Fig. 5. Plot showing the relationship between pelargonidin-3-O-acetylglucoside concentrations and the genotype classes at two unlinked loci on LG6X2 and LG6b in the S×SS mapping population.
The x axis shows the genotype classes for markers AX-166507769 and AX-89795785 and the y axis shows the pelargonidin-3-O-acetylglucoside concentrations in mg 100 g−1 FW. Double homozygous genotype classes in the progeny of the two markers on LG6X2 and LG6b produced the highest and lowest concentrations of pelargonidin-3-O-acetylglucoside in the ripe fruit of the progeny

