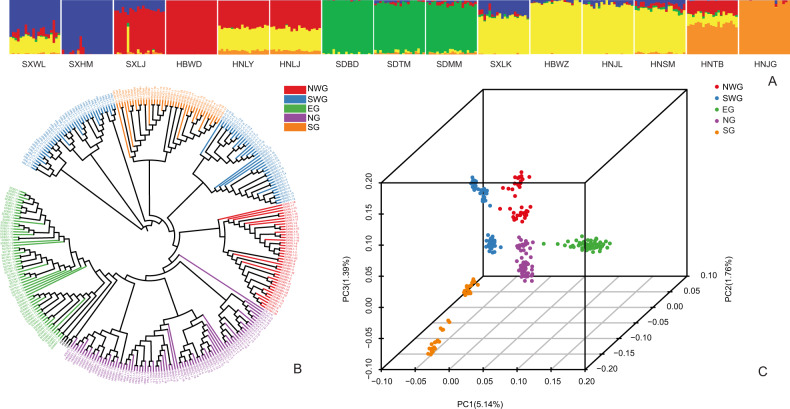
Fig. 2. Population genetic structure of Forsythia suspensa.
a Population genetic structure based on all SNPs estimated by ADMIXTURE analysis with K = 5. Each bar represents an individual, and the x-axis location specifies the sampling location. b The phylogenetic tree of all individuals of F. suspensa with F. viridissima and J. nudiflorum as outgroups was constructed using the neighbor-joining method in the program MEGA. c Each point represents an individual genotype, where colors distinguish groups. The amount of variation explained by PC1, PC2, and PC3 is 5.14%, 1.76% and 1.39%, respectively

