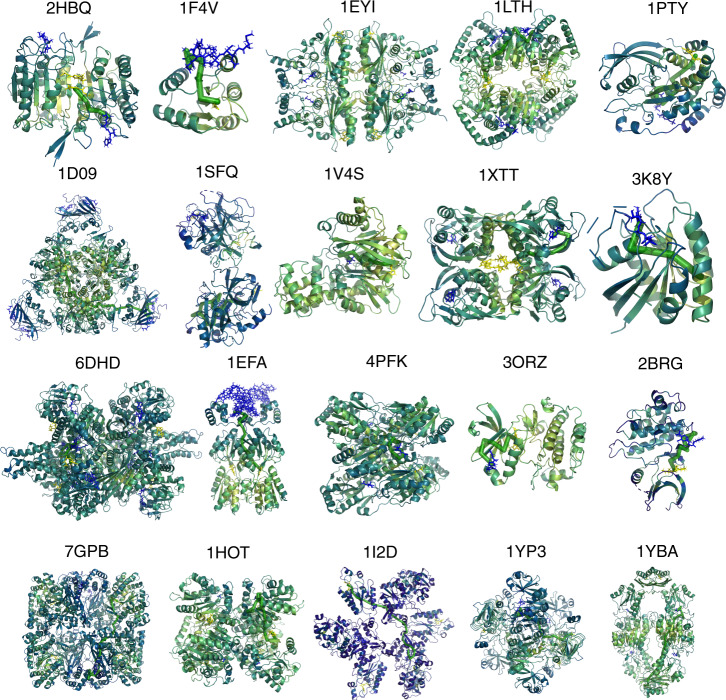
Fig. 4. Tertiary structures of all 20 proteins colored by ACI.
Ligands in active sites are colored by blue, and ligands in allosteric sites are colored by yellow. One of the highest weight pathways identified by Ohm is shown as green consecutive cylinders for each protein. Resides with high, moderate, low, and extremely low ACI values are colored by yellow, green, and blue, respectively. Ohm analysis results for all 20 proteins are provided in Supplementary Data 3.

