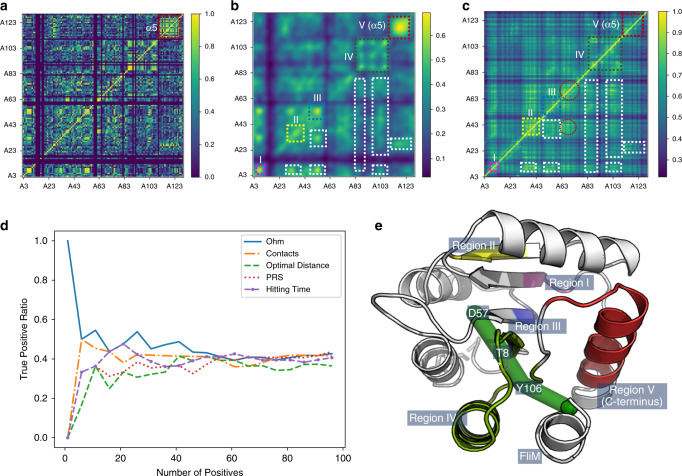
Fig. 5. Comparison of allosteric correlations measured by CHESCA and predicted by Ohm.
a Allosteric correlations measured by CHESCA. Blank rows and columns are caused by missing data for residues 1, 2, 13, 14, 15, 16, 18, 19, 59, 60, 61, 65, 82, 90, 92, and 110. CHESCA data are in Supplementary Data 1. b Allosteric correlations measured by CHESCA subjected to Gaussian filtration. Dashed boxes, including the colored boxes (I, II, III, IV, and V) and the white boxes, are common regions to CHESCA and Ohm analysis. c Allosteric correlations predicted by Ohm. Regions in dashed circles only appear in allosteric correlations predicted by Ohm. d The true-positive ratio of allosteric correlations predicted by Ohm, native contacts, the shortest paths lengths, PRS, and the hitting time. Data of all methods for the comparison can be found in Supplementary Data 3. e Tertiary structure of CheY Regions indicated in panels b and e are labeled. The green cylinders represent the allosteric pathway.

