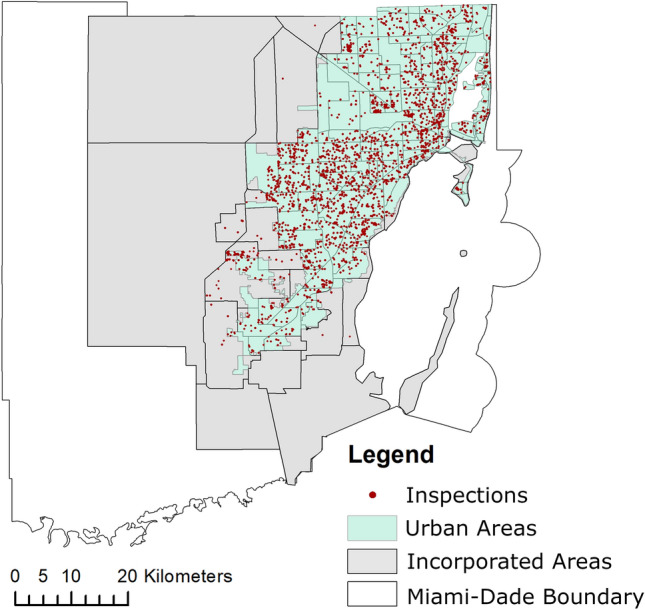
Figure 2.

Map showing the location of the mosquito inspections in Miami-Dade, Florida from June 1st, 2018 to October 31st, 2019. The red dots represent the point source location of the 311 complaint calls that were investigated for potential sources for mosquito breeding and development in a 50-m radius from the complaint location. Figure was produced using ArcGIS 10.2 (Esri, Redlands, CA) using freely available layers from the Miami-Dade County’s Open Data Hub—https://gis-mdc.opendata.arcgis.com/.
