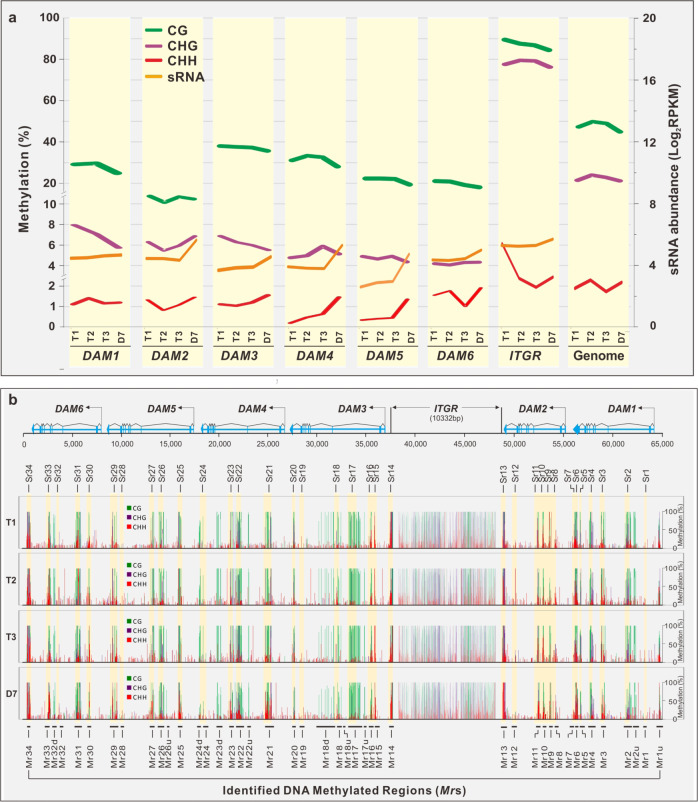
Fig. 3. BS-seq analysis.
a CG, CHG, and CHH methylation in six DAMs, ITGR, and peach genome. Methylation rate (%) was indicated on the left y-axis and sRNA abundance (orange) expressed by Log2 RPKM on the right y-axis. The treatment time point T1, T2, T3 and D7, and DAM genes are indicated at the bottom. b Cluster of methylated regions (Mrs). A total of 44 Methylated regions (Mrs) are marked in the bottom, while the corresponding Sr regions highlighted in yellow and denoted on top. Number of methylated regions starts from DAM1 to DAM6 for the sake of consistence with DAM position. Green—CG methylation. Purple—CHG methylation. Red—CHH methylation. The Mrs independent of siRNAs are named as downstream or upstream of adjacent Mrs (e.g. Mr2u, Mr17u, Mr18u, Mr18d, etc.)

