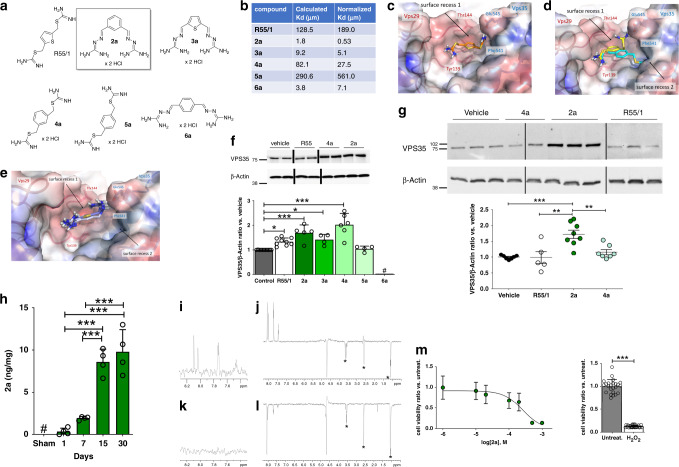
Fig. 2. Structure and binding modes for R55/1 and compounds 2a–6a.
a Standard R55/1, compounds bearing one (3a–5a) or two modifications (2a, 6a), b Calculated and normalized Kd values for compounds 2a–6a. c R55/1 (orange carbons atoms) positioned near a small cavity (surface recess 1) outlined by Tyr139 and Thr144 in VPS29, and Phe541 in VPS35. d 1,3-meta substituted 4a (yellow carbon atoms) better fits into surface recess 1; 1,4-meta substituted 5a (cyan carbon atoms) repositions an isothiourea group in surface recess 2, with a predicted loss of affinity. e docking poses of 1,3-phenyl bis-isothiourea 3a (violet carbon atoms) and 1,3-phenyl bis-guanylhydrazone 2a (grey carbon atoms) in their putative binding site. f representative WB for VPS35 and β-Actin in treated Neuro2a cells (10 μM, 48 h, 3 × 10⁵ cells/well). Dividing black lines mark lanes cropped from the same filter. The histogram shows quantifications (control: n = 11 independent wells; R55/1: n = 9 independent wells; 2a: n = 5 independent wells; 3a: n = 4 independent wells; 4a: n = 6 independent wells; 5a: n = 4 independent wells; 6a: n = 4 independent wells). Control vs. R55/1: p = 0.036, control vs. 2a: p < 0.0001, control vs. 3a: p = 0.048, control vs. 4a: p < 0.0001. g representative WB for VPS35 and β-Actin in SCs extracts from vehicle-, R55/1-, 2a- and 4a-treated (10 mg/kg for 7 days) C57BL/6J mice. Dividing black lines mark lanes cropped from parallel filters. The histogram shows quantifications (mean ratio ± SD, vehicle: n = 7 independent mice; R55/1: n = 5 independent mice; 2a: n = 8 independent mice; 4a: n = 7 independent mice. Vehicle vs. 2a p < 0.0001, R55/1 vs. 2a p = 0.002, 2a vs.4a p = 0.0012). h Brain uptake of compound 2a in C57BL/6J mice injected (10 mg/kg) with 2a (1, 7, 15, and 30 days, n = 4 independent mice/time point, mean ± SD, p < 0.0001). i–l STD-NMR (i, k) and WL (j, l) spectra of 2a (500 μM). Spectra (i) and (j) are in presence of VPS29-VPS35 complex (10 μM), spectra (k) and (l) are controls. Stars indicate the proton resonances of the buffer. m Neuro2a cell viability (mean ± SD, reported as ratio versus controls) in presence of increasing amounts of 2a (1–1000 µM, 48 h, 4 × 10⁴ cells/well, n = 24 independent wells/group, three experiments). Nonlinear fitting shows an LD50 of 257.9 µM. Controls were established by H2O2 treatment (200 µM for 48 h, n = 24 independent wells/group, untreated vs. H2O2: p < 0.0001). One-way ANOVA followed by Tukey's Multiple Comparison test was used to analyze f, g, and h plots. Two-tailed Student’s t-test was used to analyze data from m. *p < 0.05, **p < 0.01, ***p < 0.001.

