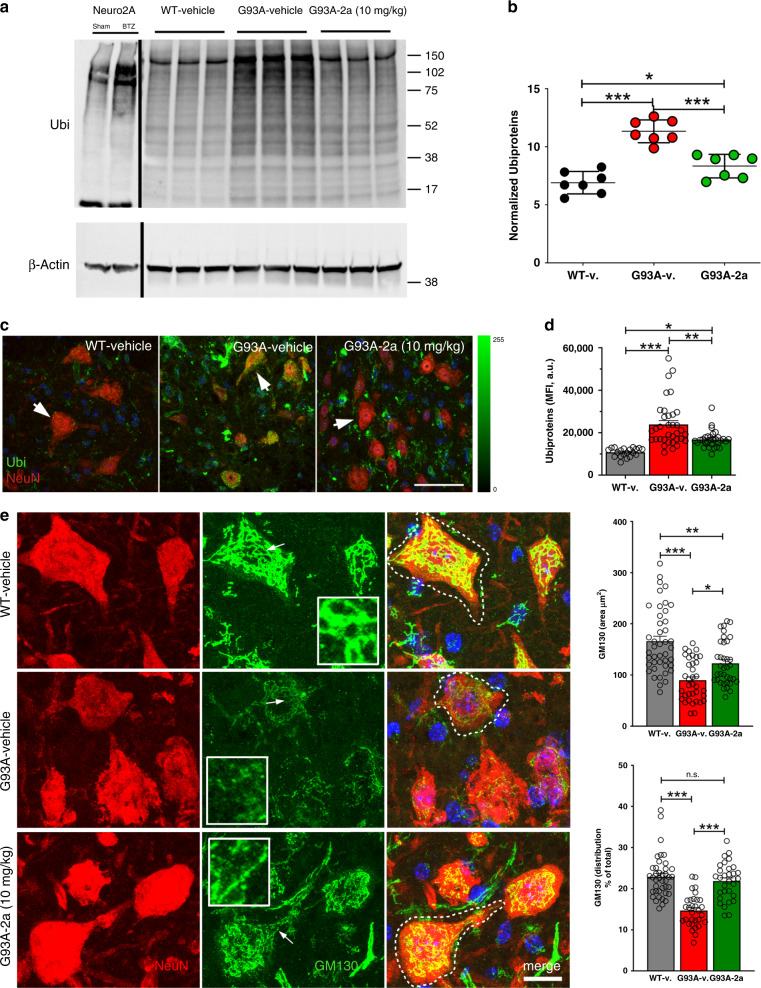
Fig. 7. Compound 2a reduces protein ubiquitination in G93A mice.
a Representative WB for poly-ubiquitinated proteins in experimental controls: Neuro2a cells (3 × 10⁵ cells/well) treated with sham or with Bortezomib (10 nM, BTZ); and in lumbar SC extracts from vehicle-treated WT mice, vehicle-treated G93A mice and compound 2a-treated G93A mice (10 mg/kg, day 100). Normalization of proteins load was done by β-Actin. Dividing black lines show lanes cropped from independent filters. b Collective densities of lanes, normalized for β-Actin, were used for quantification (n = 7 independent mice/group data are examined from three independent experiments, lines show means + SD). WT-v vs G93A-2a: p = 0.013, p < 0.0001 for the other comparisons. c Maximum projections of confocal stacks from lumbar SCs sections of vehicle-treated WT, vehicle-treated G93A and compound 2a-treated G93A mice (10 mg/kg, sampled at day 100) labelled for ubiquitin (Ubi) and NeuN (n = 3 independent mice/group). Averaged fluorescence intensities (MFI, lines show means + SEM) in gated Neun+ MNs of Ubi (Alexafluor 488) are reported in d (arrows indicate representative cells; WT-v: n = 20 independent MNs, G93A-v: n = 35 independent MNs, G93A-2a: n = 31 independent MNs, data are examined from three independent experiments; WT-v vs. G93A-2a: p = 0.014, p < 0.0001 for the other comparisons). The epi-fluorescence scale is shown in right side. e Maximum projections of confocal stacks (step of 0.4 µm) of MNs labelled for NeuN and GM130. Arrows in each panel indicate regions showed at high magnification in insets. Quantifications (means ± SEM) of GM130 area are shown in upper e, (WT-v: n = 43 independent MNs, G93A-v: n = 36 independent MNs, G93A-2a: n = 36 independent MNs, data are examined from three independent experiments; G93A-v vs. G93A-2a: p = 0.0018; p < 0.0001 for the other comparisons). Quantifications of GM130 distribution (mean% of the cell area ± SEM) are shown in lower panel e, (WT-v: n = 40 independent MNs, G93A-v: n = 31 independent MNs, G93A-2a: n = 31 independent MNs, data are examined from three independent experiments; WT-v vs. G93A-2a: p = 0.63, p < 0.0001 for the other comparisons). One-way ANOVA followed by Tukey's Multiple Comparison test was used to analyze data of b–e. *p < 0.05, **p < 0.01, ***p < 0.001, n.s. not significant. Scale bar 50 µm in c and 20 µm in e.

