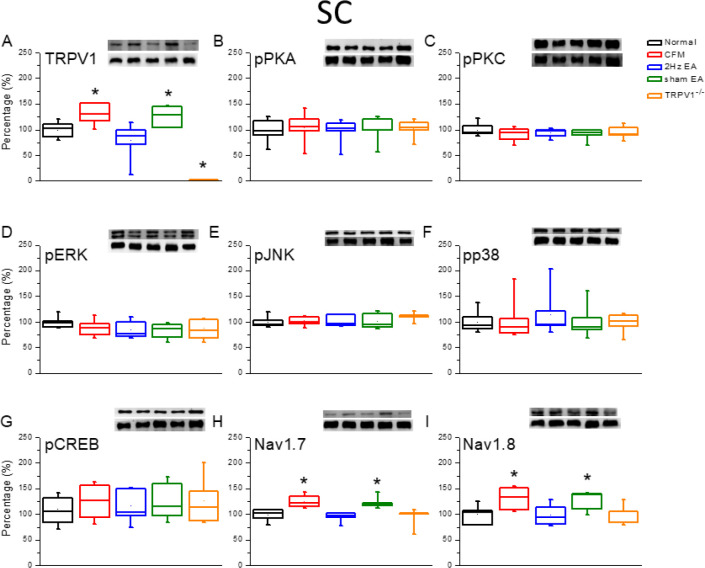
Figure 3.
Expression levels of TRPV1-associated signaling pathways in the mice lumbar SC. (A) TRPV1, (B) pPKA, (C) pPKC, (D) pERK, (E) JNK, (F) pp38, (G) pCREB, (H) nav1.7, and (I) Nav1.8 expression levels in Normal, CFM, CFM+2 Hz EA, CFM+sham EA, and TRPV1-/- mice (from left to right). Normal: normal mice; CFM: chronic fibromyalgia mice; 2 Hz EA: CFM+2 Hz EA. Sham EA: CFM+sham EA. TRPV1-/-: CFM+TRPV1-/-. *P<0.05 compared with the normal group. The Western blot bands at the top show the target protein. The lower bands are internal controls (β-actin or α-tubulin)

