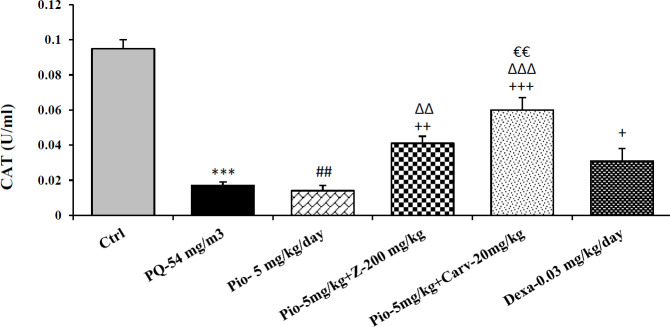
Figure 2.
Serum level of catalase (CAT) in different studied groups. The results are expressed as mean±SEM (n=5 in each group). ***P<0.01 compared to the control group. ++P<0.01 and +++P<0.001compared to the PQ group, ##P<0.01 compared to dexamethasone treated group. ∆∆P<0.01 and ∆∆∆P<0.001 compared to pioglitazone treated group. €€P<0.01 compared to group treated with combination of pioglitazone ant the extract. Comparisons between different groups were made using one-way ANOVA followed by Tukey’s multiple comparison test. Ctrl, control group, PQ-54 mg/m3, group exposed to paraquat aerosol with dose of 54 mg/m3, Pio-5 mg/kg/day, Pio-5 + Z- 200 mg/kg/day, Pio-5 + Carv-20 mg/kg/day and Dex-0.03mg/kg/day, groups exposed to PQ-54 mg/m3 and treated with 5 mg/kg/day pioglitazone, combination or 200 Zataria multiflora and 20 mg/kg/day and carvacrol respectively or dexamethasone respectively

