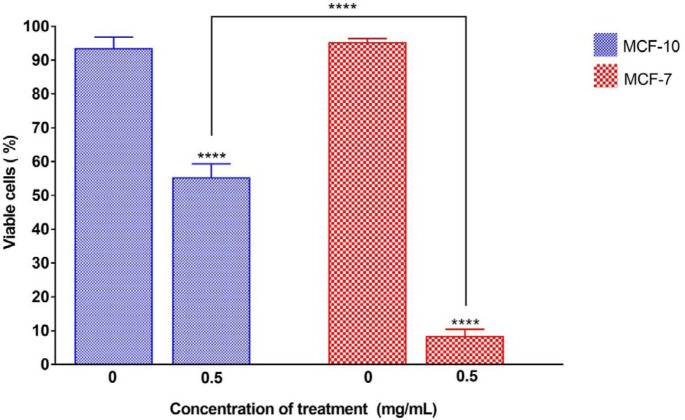
Figure 3.
Percentage of viable cell lines after 48 hr of exposure to 5 mg/ml of the nanocomposite. The stars on each column show a significant difference compared with the related untreated control, and the interconnected lines indicate a significant difference between the different treated cell lines. P-value<0.0001:****

