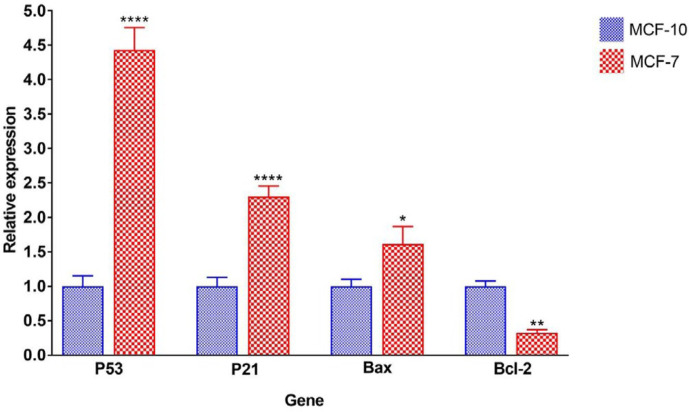
Figure 4.
Relative expression of P53, P21, Bax, and Bcl-2 genes in MCF-10 and MCF-7 cell lines treated with 5 mg/ml of nanocomposite. The stars on each column showed a significant difference compared with the control (MCF-10 cell line) and the stars on the lines indicate a significant difference between the various treated cell types. P-value<0.05:*, P-value<0.01:**, P-value<0.001:***, P-value<0.0001:****, n.s.: not significant

