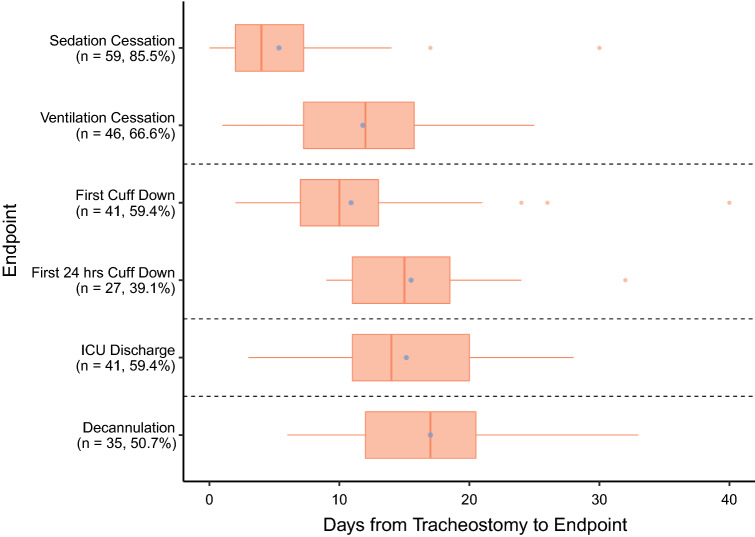
Fig. 1.
Boxplot representing landmarks in tracheostomy care. The boxes represent interquartile ranges with thick lines representing medians. Whiskers represent the lowest and highest observations ≤ 1.5 times the inter-quartile range from the box and orange dots (outside boxes) represent outliers. Purple dots (inside boxes) represent means

