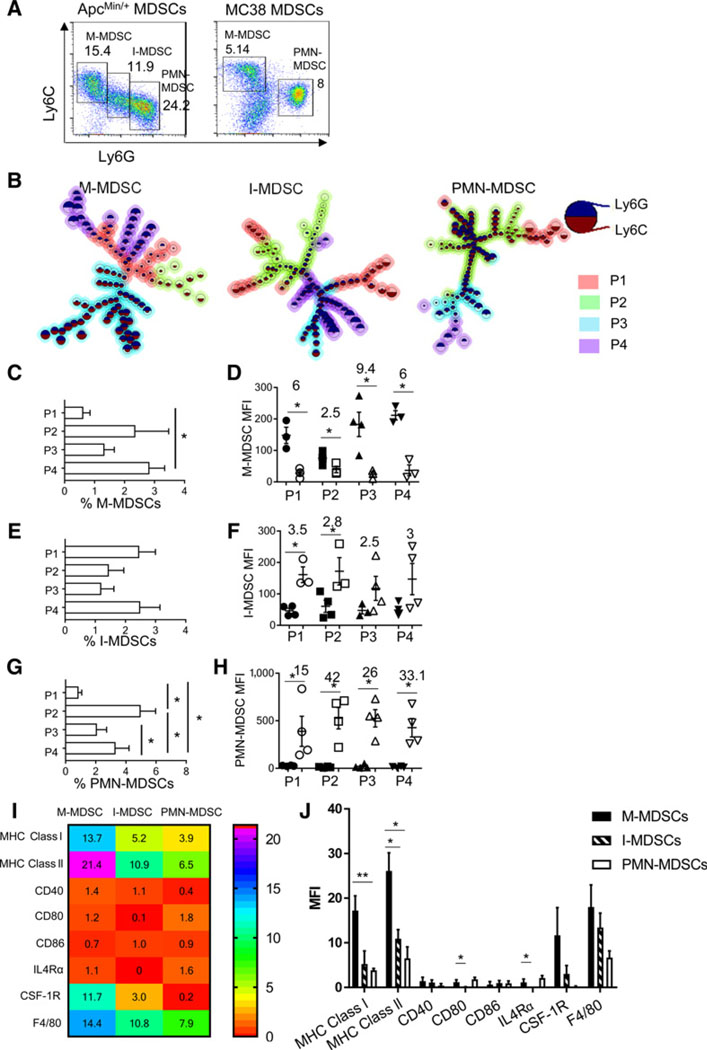
Figure 3.
I-MDSCs accumulating in ApcMin/+ mice are a distinct subset. A, Representative flow cytometry plots of splenic MDSCs from ApcMin/+ mice and MC38 tumor-bearing mice (tumor volume:1,200 mm3. B, MST diagrams of ApcMin/+ MDSC subsets produced by FlowSOM shows subpopulations (P1, P2, P3, P4) in all MDSCs. Each node represents a group of cells with similar MFI; location of the nodes indicates interconnectedness, and size of the node indicates the number of cells. C–H, Frequency and expression level of Ly6C (closed symbols) and Ly6G (open symbols) in subpopulations of each MDSC subset. Numbers above plots in D, F, and H indicate fold, difference between Ly6C and Ly6G (D), and Ly6G versus Ly6C (F and H). Heatmap (I) and column plot (J) of MFIs of MHC class I and II, CD40, CD80, CD86, IL-4Rα, CSF-1R, and F4/80 on ApcMin/+ MDSC subsets. n = 3 to 4; *, P < 0.05.

