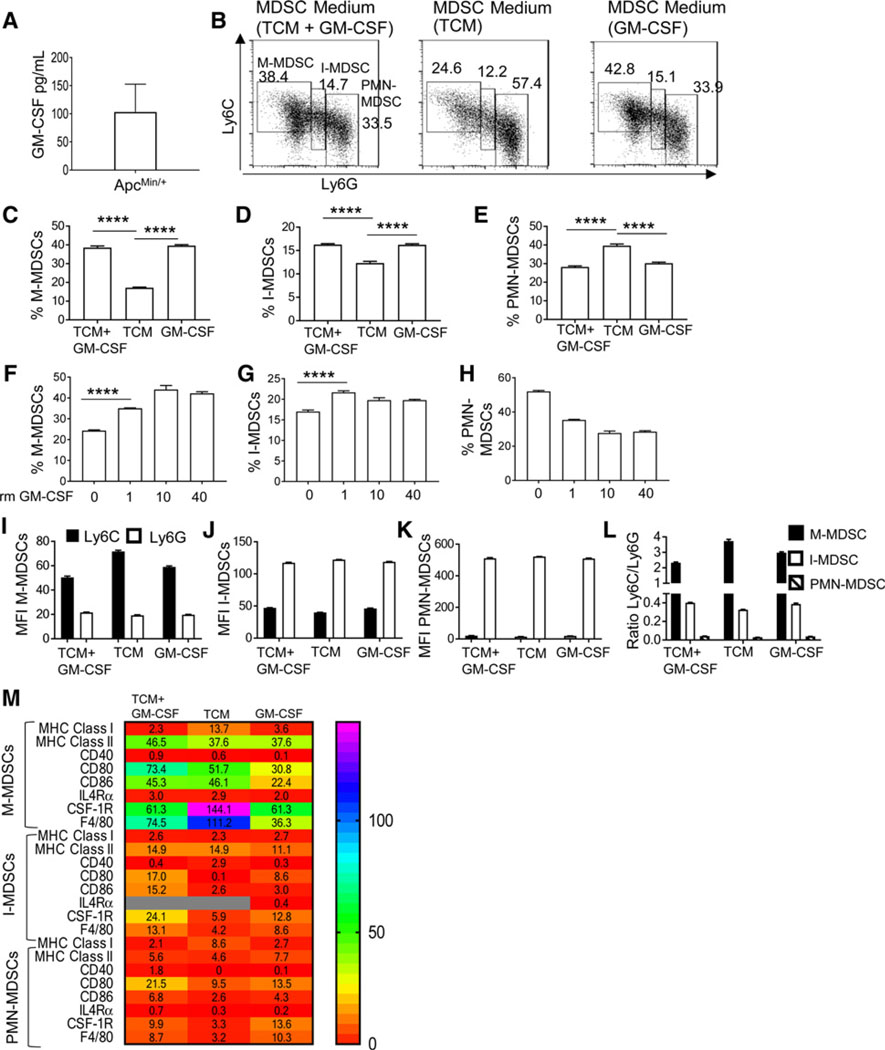
Figure 4.
I-MDSC accumulation is GM-CSF–dependent. A, GM-CSF production by intestinal cells including tumor cells in ApcMin/+ mice was assessed by ELISA. B, Representative plots of MDSC subsets in BM-MDSCs generated from bone marrow cells cultured with MC38 TCM and recombinant mouse GM-CSF (40 ng/mL), TCM alone, or GM-CSF alone. C–E, Percentage of MDSCs generated as described earlier (n = 4). Percentage of M-MDSCs (F), I-MDSCs (G), and PMN-MDSCs (H) in BM-MDSCs generated with increasing doses of rm GM-CSF. MFIs of Ly6C and Ly6G (I–K) and ratio of Ly6C versus Ly6G (L) of in vitro–generated MDSCs. M, Heatmap showing the expression (MFI) of MHC class I, MHC class II, CD40, CD80, CD86, IL4Ra, CSF-1R, and F4/80 in subsets of BM-MDSCs generated as described in A (n = 2). Gray boxes in heatmap show undetected values. ****, P < 0.0001.

