Figure 1.
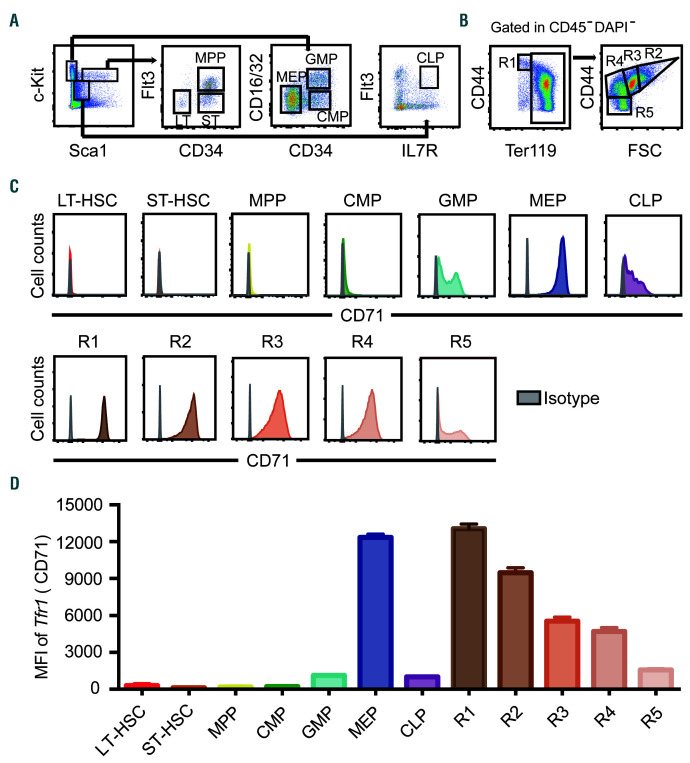
Tfr1 expression in hematopoietic stem/progenitor cells. (A) Representative gating strategy for analyzing long-term hematopoietic stem cells (HSC) (LT-HSC, Lin−cKit+Sca1hiCD34−Flt3−), short-term HSC (ST-HSC, Lin−cKit+Sca1hiCD34+Flt3−), multipotent progenitor (MPP, Lin−cKit+Sca1hiCD34+ Flt3+) cells, common myeloid progenitor (CMP, Lin−cKit+Sca1-CD34+ CD16/32int) cells, granulocyte-macrophage progenitor (GMP, Lin-cKit+Sca1-CD34+CD16/32hi) cells, megakaryocyte-erythroid progenitor (MEP, Lin−cKit+Sca1-CD34−CD16/32lo) cells, and common lymphoid progenitor (CLP, Lin−cKitintSca1intIL-7R+Flt3+) cells. (B) Erythrocytes gating strategy was used based on the expression levels of Ter119 and CD44: R1, proerythroblasts (Ter119loCD44hi); R2, early basophilic erythroblasts (CD44hiFSChi); R3, polychromatophilic erythroblasts (CD44hiFSCmed); R4, orthochromatophilic erythroblasts (CD44medFSCmed); and R5, mature erythrocytes (CD44loFSClo). (C) Flow cytometric analysis of Tfr1 expression in HSPC and erythroblasts in fetal liver of E16.5 mouse embryos. Grey histogram: isotype control (Rat IgG2a, k-PE). (D) Quantification of the flow cytometry data in C, showing the mean fluorescence intensity (MFI) of Tfr1 in the indicated hematopoietic stem/progenitor cells (HSPC) and erythroblasts.

