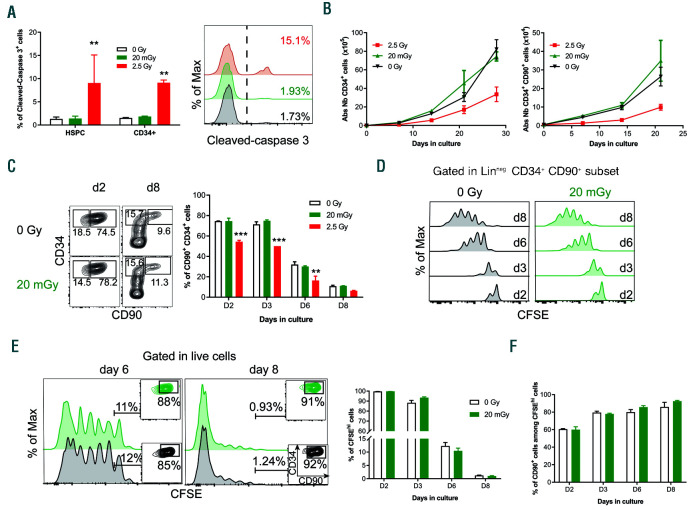
Figure 3.
Low doses (LD) of ionizing radiations (IR) do not induce apoptosis and do not modify the cell cycle in human hematopoietic stem progenitor cells (HSPC). (A) CD34+ cells were irradiated and cultured for 6 hours (h) at 37°C, then stained for cell surface markers and fixed. Cleaved-caspase 3 protein expression was analyzed by FACS. Percentage of cleaved-caspase 3+ cells on CD34+ CD38low CD45RA− CD90+ HSPC and on total CD34+ (left panel) and overlay histograms of cleaved-caspase 3 expression on HSPC (right panel) are represented in function of IR doses. One representative experiment out of two is shown. (B) Sorted CD34+ CD38low CD45RA−CD90+ HSPC were irradiated or not and co-cultured with MS5 stroma cell line for several days. At several time points, cells were numerated and stained for cell surface markers. The numbers of CD34+ cells (left) and LinnegCD34+CD90+ cells (right) were monitored over time. One representative experiment out of two is shown. (C-F) Sorted CD34+ CD38low CD45RA− CD90+ HSPC were first stained with carboxyfluorescein hydroxysuccinimidyl ester (CFSE), irradiated and cultured for several days. One representative experiment out of two is shown. (C) Differentiation of CD34+ CD38low CD45RA− CD90+ HSPC in culture was followed by using expression levels of CD90 and CD34 surface markers. Dot plots (left panel) represent CD90 and CD34 expression after 2 and 8 days of culture for control and 20 mGy-irradiated HSPC. Histogram bars (right panel) represent the percentage of LinnegCD34+CD90+ cells at different days of culture after IR. (D) Levels of carboxyfluorescein succinimidyl ester (CFSE) fluorescence in the LinnegCD34+CD90+ subset at different days of culture in control and 20 mGy conditions. No differences in cell division can be detected between both conditions. (E) Histogram representing CFSE staining in the HSPC-derived bulk cells at days 6 and 8 of culture in control and 20 mGy conditions (left panels). Histogram bars show CFSE labeling loss over culture time in the bulk population (right panel). (F) Percentage of LinnegCD34+CD90+ cells in CFSEhi cells in control and in 20 mGy conditions. Results are shown as mean±standard error of mean. **P<0.01, ***P<0.001 (Mann and Whitney statistics). Abs Nb: absolute numbers.

