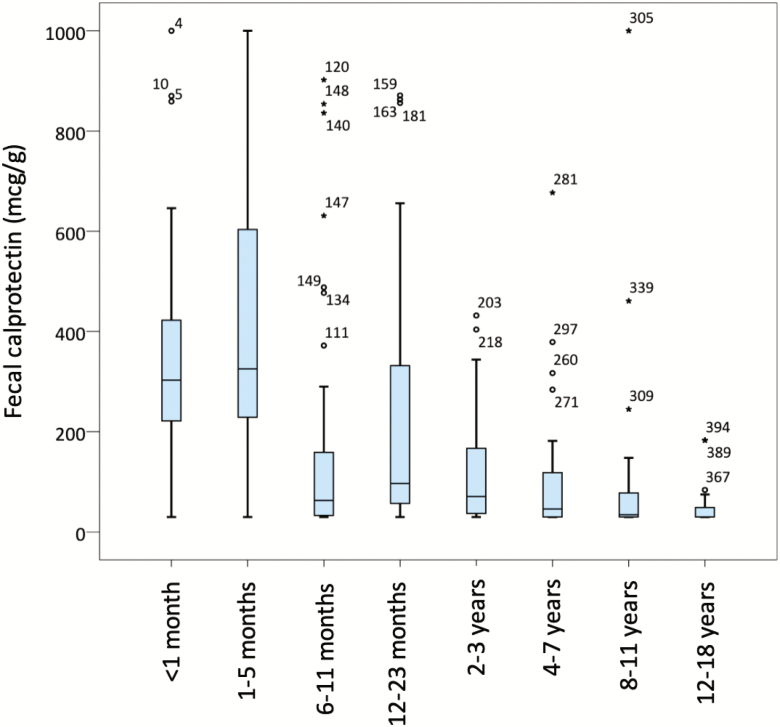
Figure 2.
Box-and-whiskers plots showing fecal calprotectin (FC) values for each age group. The line in the middle of the boxes represents the median FC. The bottom and top of the box indicate the 25th and 75th percentile. The lower and upper whiskers show the least and greatest value excluding outliers. The points and stars represent outliers and extreme outliers.

