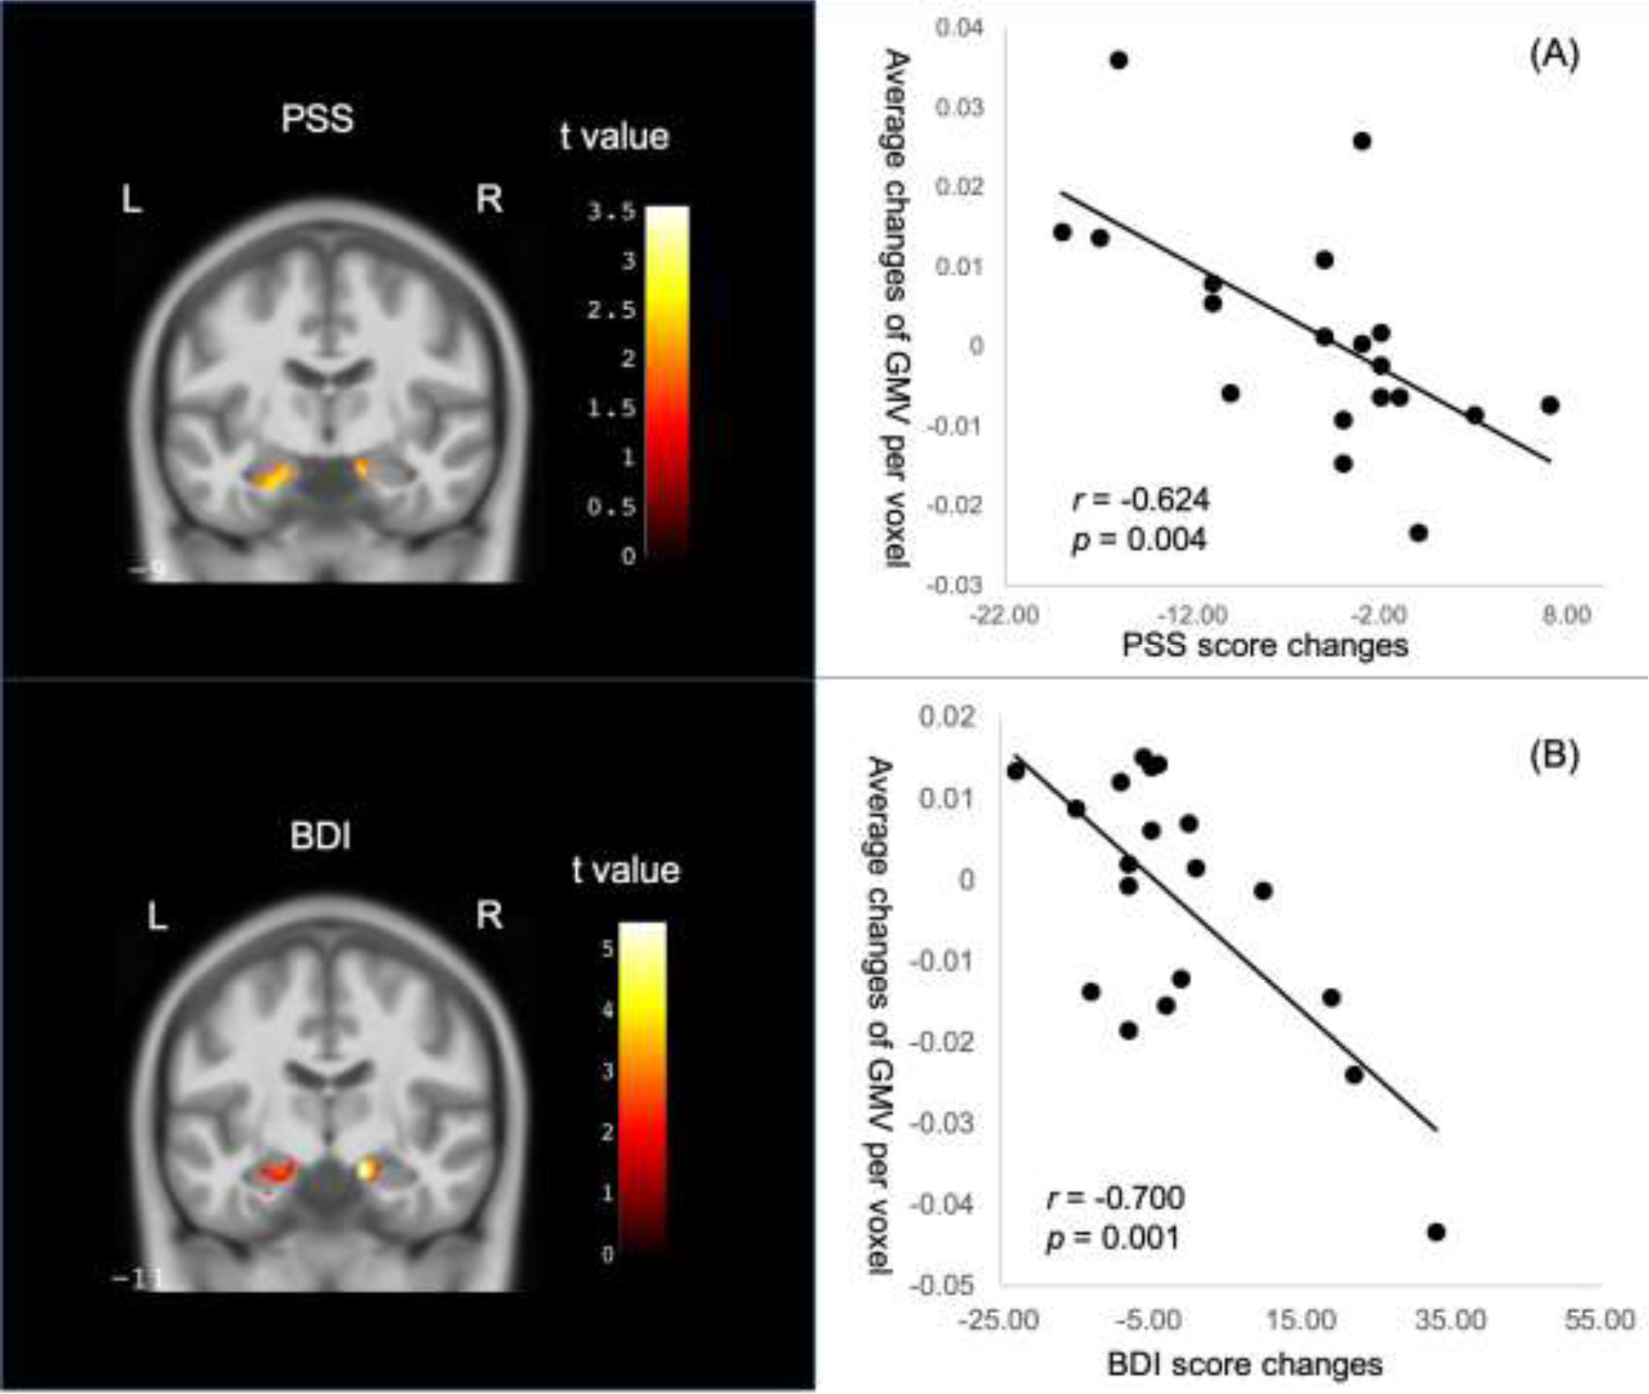
Figure 3:

Negative associations within the mindfulness group between changes of hippocampal GMV and changes of scores on the (A)Perceived Stress Scale (PSS) and (B)Beck Depression Inventory (BDI). L: left side, R: right side. Scatter plots demonstrate correlations between symptom changes and the averages of modulated GMV changes among all voxels in the significant clusters (see Table 2). Color bar indicates the absolute t-values of the regression model.
