Fig. 2.
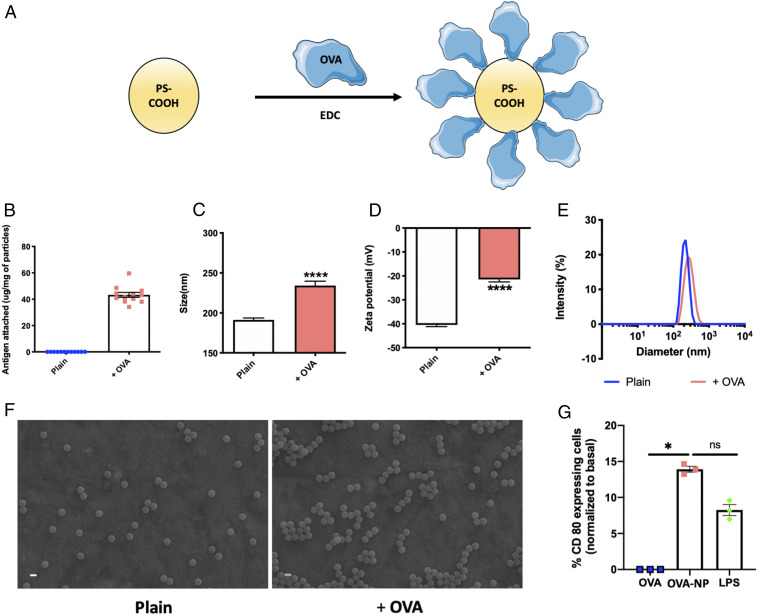
Characterization of protein-capped nanoparticles. (A) Scheme of protein attachment to polystyrene carboxylate nanoparticles using EDC chemistry. (B) Amount of antigen attached to PS-COOH (n = 12). (C) Particle size in nanometers of plain and protein-capped nanoparticles (n = 6). Significantly different (Student’s t test): ****P < 0.0001. (D) Zeta potential in millivolts of plain and protein-capped nanoparticles (n = 6). Significantly different (Student’s t test): ****P < 0.0001. (E) Particle size distribution of plain and protein-capped nanoparticles. (F) Scanning electron micrographs of plain and protein-capped nanoparticles. (Scale bars, 200 nm.) (G) Dendritic cell maturation evaluated in terms of % CD80 expression (normalized to basal expression) (n = 3 for all groups). Significantly different (one-way ANOVA followed by Tukey’s HSD test): *P < 0.05; ns, not significantly different. Data in B–D and G are expressed as mean ± SEM.

