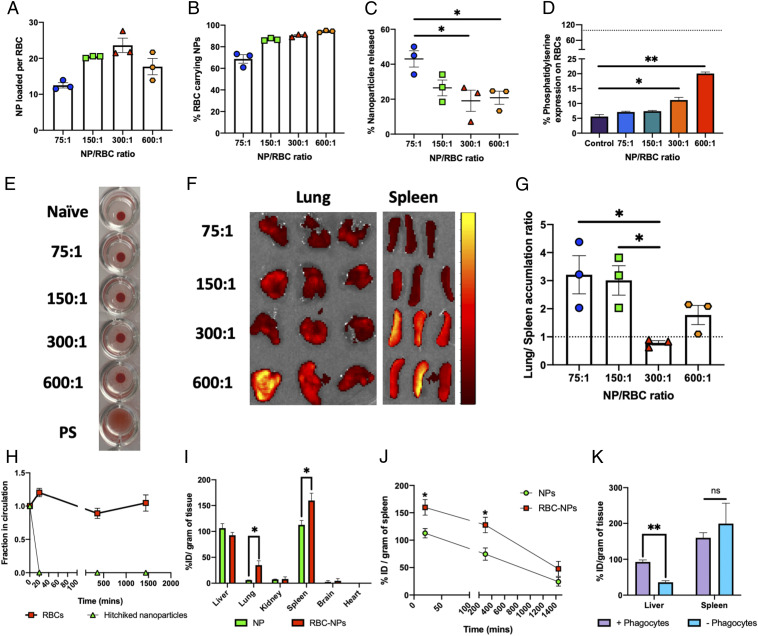
Fig. 3.
Engineering nanoparticle–erythrocyte–hitchhiking parameters to achieve spleen targeting. (A) Nanoparticles loaded per erythrocyte for different feed ratios of nanoparticles to erythrocytes (n = 3 for all groups). (B) Percentage of erythrocytes carrying nanoparticles (determined by flow cytometry) for different feed ratios of nanoparticles to erythrocytes (n = 3 for all groups). (C) Percentage of nanoparticles released from erythrocytes following in vitro shear studies at the lung corresponding to shear stress (6 Pa). Significantly different (one-way ANOVA followed by Tukey’s HSD test): *P < 0.05. (D) Erythrocyte damage caused by nanoparticles, evaluated by changes in percentage of phosphatidylserine expression, for different feed ratios of nanoparticles to erythrocytes (n = 3 for all groups). The dotted line indicates positive-control (polystyrene beads) mean value. Significantly different (one-way ANOVA followed by Tukey’s HSD test): *P < 0.05, **P < 0.01. (E) Optical agglutination assay demonstrating minimal aggregates induced by nanoparticles to erythrocytes. All of the tested nanoparticle-to-erythrocyte ratios were similar to naïve control as opposed to polystyrene beads which induced matrix-shaped aggregates. (F) IVIS images of lungs and spleen harvested from mice 20 min after being injected with erythrocytes incubated at different nanoparticle-to-erythrocyte ratios. The scale indicates low (maroon) to high (bright yellow) radiant efficiency. (G) Lung-to-spleen accumulation ratios computed by using radiant efficiencies of these organs from IVIS imaging (n = 3 for all groups). The dotted line indicates equal lung and spleen accumulation. Significantly different (one-way ANOVA followed by Tukey’s HSD test): *P < 0.05. (H) Fraction of particles and erythrocytes remaining in circulation, evaluated by their parallel tracking using flow cytometry (n = 5). (I) Biodistribution of free nanoparticles and hitchhiked nanoparticles in different organs, expressed in terms of % injected dose per gram of tissue, harvested 20 min after injection (n = 3 for all groups). Significantly different (Student’s t test): *P < 0.05. (J) Kinetics of spleen accumulation of free and hitchhiked nanoparticles monitored over 24 h after injection (n = 3 for all groups). Significantly different (Student’s t test): *P < 0.05. (K) Effect of phagocyte depletion on hitchhiked nanoparticle biodistribution in the two most important organs of the mononuclear phagocytic system, 20 min after injection (n = 3 for all groups). Significantly different (Student’s t test): **P < 0.01. Data in A–D and G–J are expressed as mean ± SEM.

