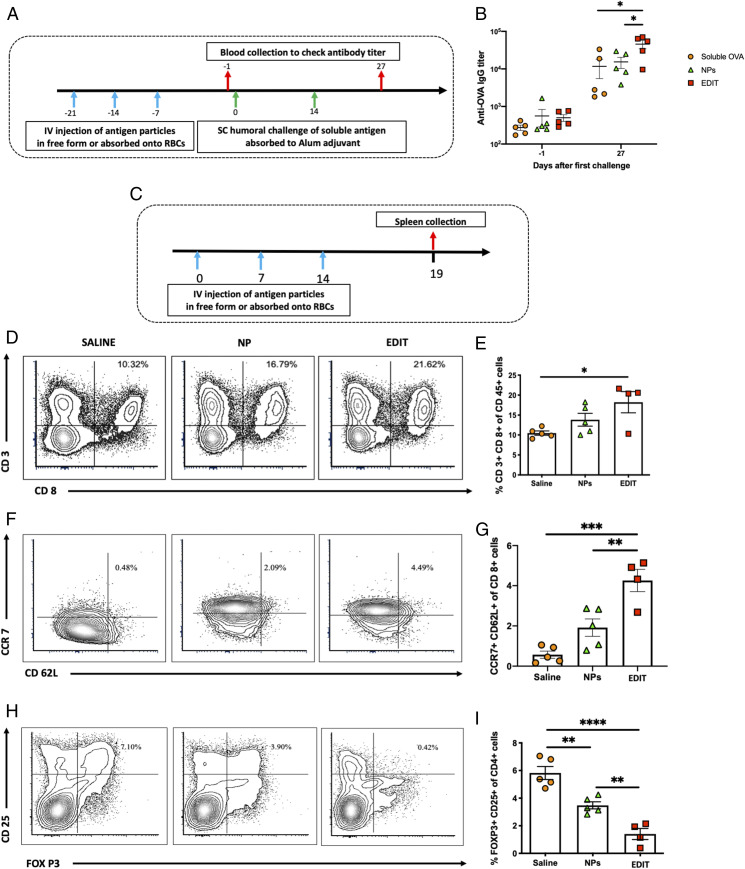
Fig. 4.
Immunological consequences of nanoparticle spleen handoff. (A) Schedule for evaluating systemic antibody (humoral) responses of hitchhiked nanoparticles. (B) Anti-OVA IgG titer evaluated 1 d before the first immune challenge (day −1) and 13 d after the second immune challenge (day 27) (n = 5 for all groups). Significantly different (one-way ANOVA followed by Tukey’s HSD test): *P < 0.05. (C) Schedule for evaluating systemic cellular immune responses of hitchhiked nanoparticles. (D) Representative flow cytometry analysis images of CD3+ CD8+ cells in the spleen. (E) Quantitative analysis of the percentage of CD3+ CD8+ cells in the spleen (n = 4 for the EDIT group; n = 5 for all other groups). Significantly different (one-way ANOVA followed by Tukey’s HSD test): *P < 0.05. (F) Representative flow cytometry analysis images of CCR7+ CD62L+ cells in the spleen. (G) Quantitative analysis of the percentage of CCR7+ CD62L+ cells in the spleen (n = 4 for the EDIT group; n = 5 for all other groups). Significantly different (one-way ANOVA followed by Tukey’s HSD test): **P < 0.01, ***P < 0.001. (H) Representative flow cytometry analysis images of CD25+ FOXP3+ cells in the spleen. (I) Quantitative analysis of the percentage of CD25+ FOXP3+ cells in the spleen (n = 4 for the EDIT group; n = 5 for all other groups). Significantly different (one-way ANOVA followed by Tukey’s HSD test): *P < 0.05, **P < 0.01, ****P < 0.0001. Data in B, E, G, and I are expressed as mean ± SEM.

