Fig. 5.
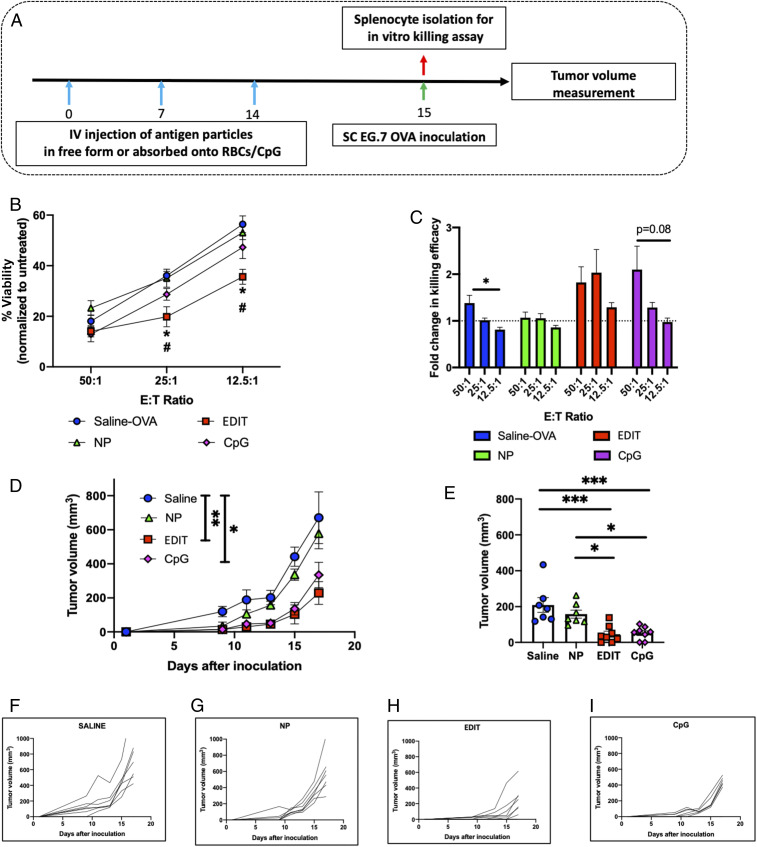
Therapeutic extension of immune modulation of hitchhiked nanoparticles for vaccination. (A) Schedule for prophylactic vaccination studies. (B) In vitro cell-killing data post immunization by various treatment groups evaluated as percent viability normalized to the untreated control at different effector-to-target ratios (n = 3 mice for all groups). Significantly different: saline OVA vs. EDIT and NPs vs. EDIT (one-way ANOVA followed by Tukey’s HSD test): *P < 0.05, #P < 0.05. (C) Fold change in in vitro cell-killing assay, comparison of fold change within each treatment group as a function of effector-to-target ratio (n = 3 mice for all groups). Significantly different (one-way ANOVA followed by Tukey’s HSD): *P < 0.05. (D) Tumor growth curves for mice inoculated after prophylactic vaccinations by different treatment groups. Statistical analysis within this figure was carried out on day 17. (E) Evaluation of tumor volumes for different groups on day 13. For D and E (n = 8 for the EDIT and CpG groups; n = 7 for the saline and NP groups), significant different (one-way ANOVA followed by Tukey’s HSD): *P < 0.05, **P < 0.01, ***P < 0.001. (F–I) Tumor growth kinetics for individual mice in (F) saline, (G) NP, (H) EDIT, and (I) CpG treatment groups. Data in B–E are expressed as mean ± SEM.

