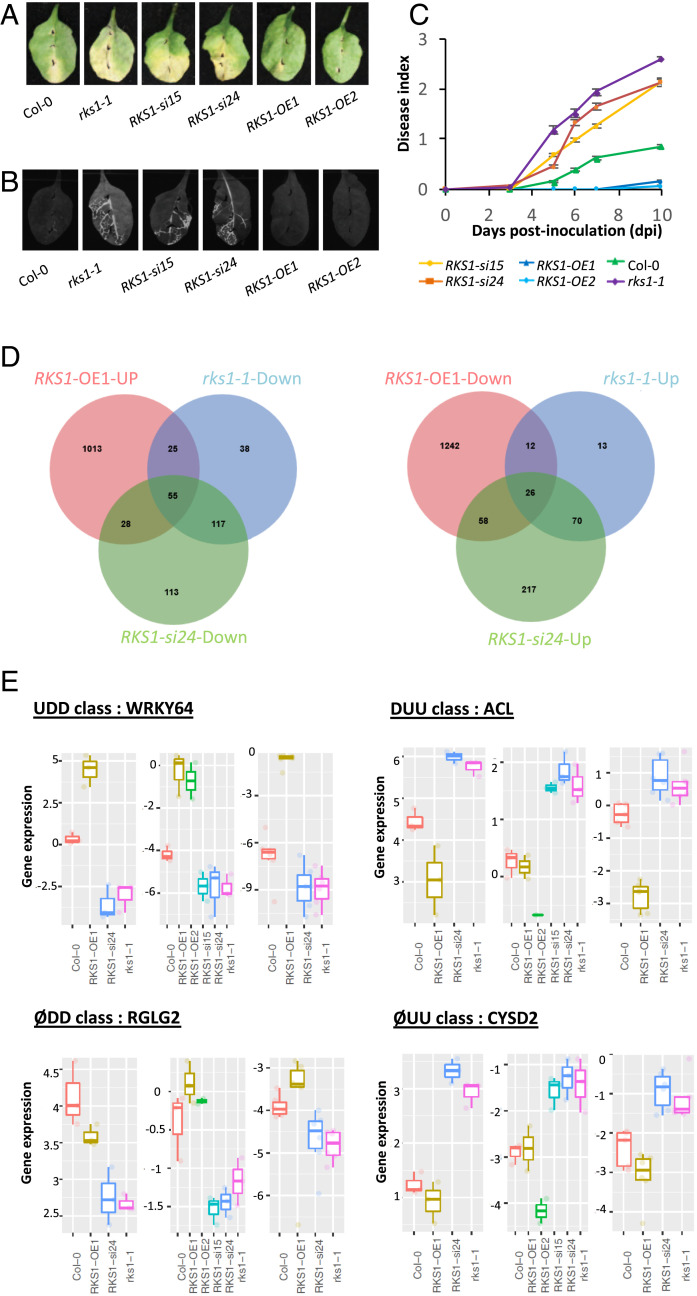
Fig. 1.
Global gene expression analyses in RKS1-deregulated transgenic lines after X. campestris pv. campestris inoculation led to the identification of 268 differentially expressed genes. (A) Visual observations of the disease symptoms 10 d after inoculation with a bacterial suspension adjusted to 109 cfu/mL. (B) Luminescence imaging illustrates quantitative and spatial aspects of leaf colonization by Xcc568. Photos were taken with a CCD camera under light (exposure time 10 ms) and dark conditions (exposure time 10 s) 7 d postinoculation with the Xcc568-Lux reporter strain. From these pictures, an overlay image was generated. (C) Time course evaluation of disease index after inoculation with Xcc568 with a bacterial suspension adjusted to 109 cfu/mL. Means and SEs were calculated from 18 plants in 3 independent experiments. (D) Venn diagrams showing the distribution of genes up- or down-regulated in the different RKS1 transgenic or mutant lines, as compared to the wild type accession Col-0. (E) Quantitative RT-PCR validation of the expression profile for four specific genes, each belonging to an expression class: WRKY64 as an example of the class UDD (up-regulated in RKS1-OE1 line, down-regulated in RKS1-si24 and in rks1-1 lines), RGLG2 as ØDD class (not affected in RKS1-OE1 line, down-regulated in RKS1-si24 and in rks1-1 lines), ACL as DUU class (down-regulated in RKS1-OE1 line, up-regulated in RKS1-si24 and in rks1-1 lines), and CYSD2 as ØUU class (not affected in RKS1-OE1 line, up-regulated in RKS1-si24 and in rks1-1 lines). From left to right and for each class: expression pattern on RNA-seq datasets, qPCR datasets using initial transcriptome samples, and independent experiment. Statistical analyses for qPCR were performed with the Wilcoxon test.

