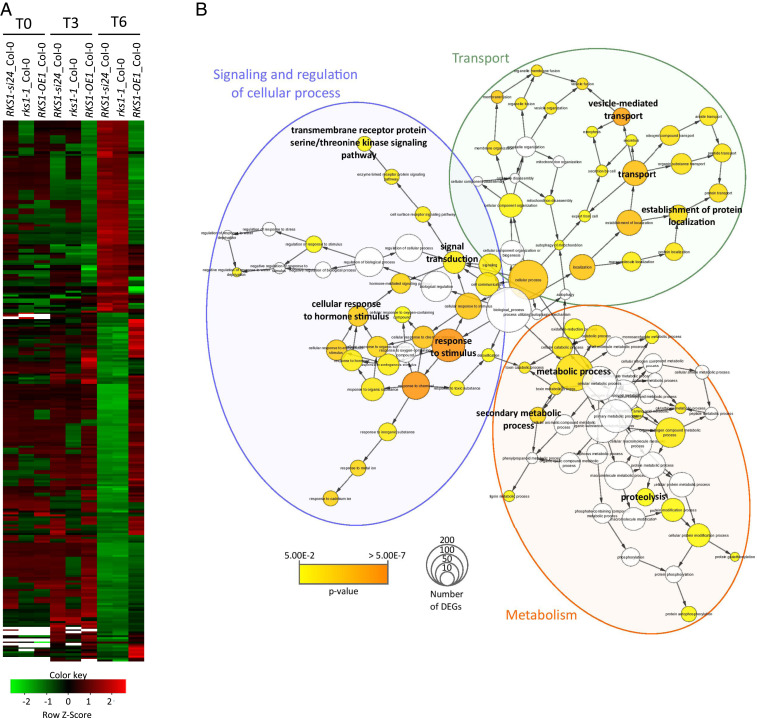
Fig. 2.
Clustering and Gene Ontology analyses of the 268 differentially expressed genes (DEGs) reveal multiple gene functional modules. (A) Clustering of the 268 DEGs whose expression is shared by the different RKS1 deregulated lines (P values < 0.05 corrected by BH statistical analysis). Each line was compared with Col-0 at 0, 3, and 6 hpi. Green indicates down-regulated values, red indicates up-regulated values, black indicates unchanged values, and white indicates missing values. (B) Gene Ontology (GO) enrichment analysis of the 268 DEGs was plotted by using BINGO module from Cytoscape software. GO process annotation was recovered for 232 of 268 DEGs. Enrichment was calculated using BINGO and plotted on GO hierarchy using Cytoscape. Circle size represents gene number in one GO, and the colors represent GO enrichment (GO white is not enriched, and color increased with P value < 0.05).

